

Chainlink price has remained bullish in August and surged by 15% in 16 days. Amid this bullish trend, the price has surpassed the 100-days EMA and has exceeded the 200-days EMA. Here is the price prediction of LINK coin based on the Bitcoin historical moves and the chart structure.
Chainlink (LINK) price overview
LINK price was trading at $9.40 at press time which has remained neutral on a daily timeframe. The market capitalization is $7.033B and the 24-hour trading volume is $236.478M. Its circulating supply is 748.1M LINK and the total supply is 1B LINK. The price has dropped by 82.1% from its all-time high while it is up by 6,246.00% from its all-time low.
Chainlink price prediction 2026
The technical chart suggests that the overall trend in LINK coin is bearish. Furthermore, buyers have bounced back and tried to flip the trend to bullish. The price has surged by 31% since July and reached the 200-days EMA. The price is facing resistance near the 200-days EMA on a daily timeframe.
If the LINK price triggers a breakout from the 200-days EMA, buyers might continue the recent bullish momentum. If the trading volume supports this momentum then the asset price might extend to the next resistance level of $15.
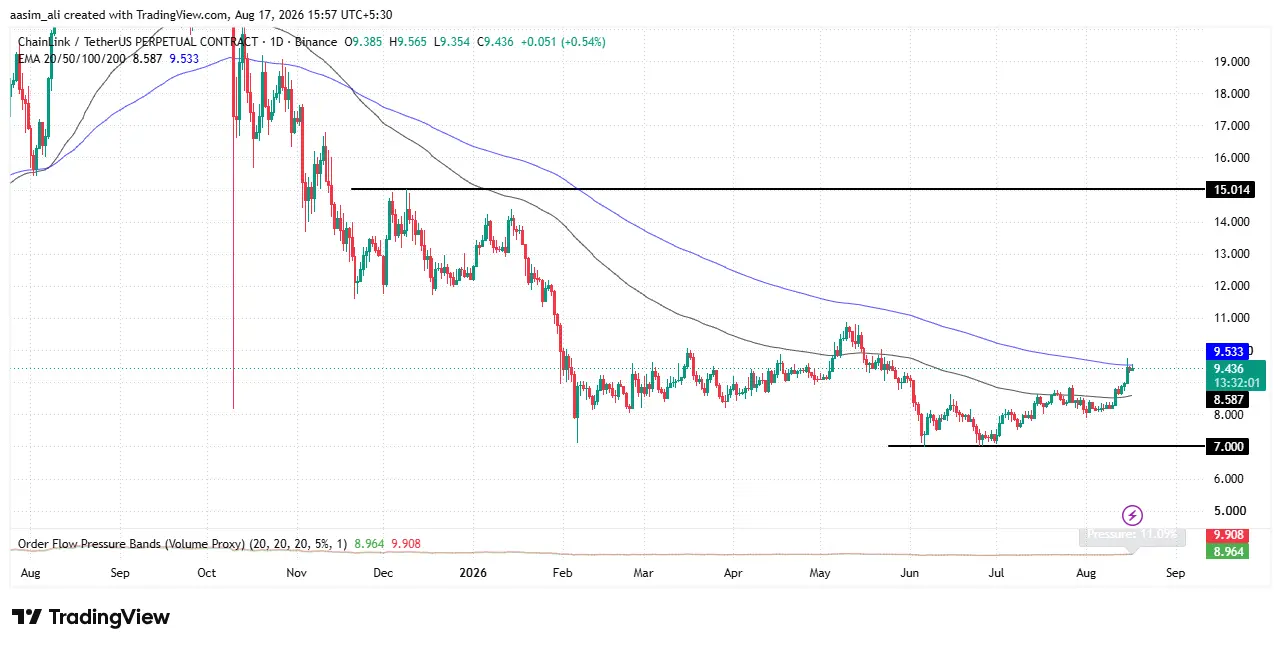 Conversely, if the Chainlink price faces resistance from the 200-days EMA then buyers might panic here. Suppose the chart structure forms any bearish candlestick pattern then sellers might take the charge and would lead the trend further. Once the price slips below the 100-days EMA then a bearish trend can be seen further. Amid this bearish trend, the price may drop to a support level of $7.
2026: Consolidation / base-building phase
- LINK is currently trading in the $8-9 range, with forecasters split between modest ($9-15) and more bullish ($22-25) targets.
- Key drivers: whether CCIP (Cross-Chain Interoperability Protocol) adoption accelerates among enterprises and banks, continued Fed rate uncertainty weighing on risk assets, and general crypto market sentiment (Fear & Greed index has been leaning bearish).
- This is treated by most analysts as a “prove the fundamentals” year rather than a breakout year.
Chainlink price prediction for 2027
Bitcoin remains the leading cryptocurrency, and most altcoins tend to follow its price action. Historical data suggests that Bitcoin has the possibility that it may form a bearish bottom in September-December as it repeats every four year, just before the start of a new bull run.
Looking at Bitcoin’s current chart structure, the price has dropped by roughly 50% from its highs. Following this sharp correction, selling pressure appears to be easing, and buyers seem to be stepping back in. BTC looks to be forming a bottom above the $60K level, and the price may consolidate in this zone over the next few months.
Once this bottom formation is confirmed, Bitcoin could enter a new bull cycle, with the potential for the price to roughly double over the following months to a year. A Bitcoin bull run typically has a positive spillover effect on altcoins as well.
For this reason, LINK price could perform well in 2027, with the potential for investor returns in the range of 3x to 4x. On a broader timeframe, Chainlink’s outlook for 2027 appears bullish.
2027: Institutional adoption becomes the swing factor
- Forecasts range from $10 to $55.
- The differentiator most analysts cite: institutional adoption pace and CCIP expansion into mainstream finance. Sites with bullish targets ($30-40+) lean heavily on this.
- Conservative models (linear 5% annual growth) assume adoption stays gradual, producing much flatter numbers ($10).
Chainlink price prediction for 2028
After the 2027 bull run, investors may see more volatility in 2028. The price could experience a few pullbacks due to mild profit booking, but the overall trend is likely to remain bullish.
Here’s what we can do in 2028: if the crypto market follows this scenario, every pullback could be viewed as a buying opportunity. However, profit booking could drag the Chainlink price down if a majority of investors choose to lock in gains.
2028: Positioned as a potential new all-time-high window
- Several forecasters (InvestingHaven, Coinpedia) flag 2028-2029 as the likely window for LINK to challenge or exceed its $52 all-time high (from May 2021).
- Reasons cited: maturing real-world asset (RWA) tokenization use cases, continued bank/insurance pilots using Chainlink oracles, and alignment with the next expected crypto bull cycle.
- More conservative technical models still put this year in the $13-25 band.
Chainlink price prediction for 2029
As we know, the crypto market follows a bull and bear cycle. After a 2-year bull run, Bitcoin could undergo a small bearish trend and can make some dips in between the bull journey that could make a slight dump in BTC price.
The thing is, BTC could be in a bullish trend on a weekly timeframe but retracement can be seen. The chart structure can form a higher high and higher low during profit booking. This retracement could impact the altcoins on a daily timeframe and strong selling pressure can be seen in LINK coin due to profit booking.
2029: Widest divergence in the data
- Estimates range from $11 (linear growth models) to $50 (bullish adoption models).
- Reasoning splits along the same fault line: models based on historical volatility/technical patterns stay moderate; models weighting oracle-market growth and RWA/DeFi/insurance integration go much higher, with Bloomberg Intelligence-referenced oracle market sizing cited as one bullish anchor.
Chainlink price prediction for 2030
If a bear-market bottom forms by the end of 2029, buyer interest could return in 2030. Should the bull cycle repeat that year, it may trigger a substantial rally and amid this broader bull run, LINK coin could see strong buying pressure, potentially rising 5x to 6x.
Conversely, if a bear bottom fails to form by the end of 2029, buyers are unlikely to step in, and LINK price could continue its bearish trend.
2030: Long-term structural bet on oracle infrastructure
- Range spans roughly $11 to $100, with a cluster of serious forecasts around $20-50.
- The bull case rests on Chainlink cementing itself as core infrastructure connecting traditional finance and blockchain (bank pilots, tokenized real estate/commodities, cross-chain settlement).
- The bear/conservative case assumes LINK just tracks modest compounding growth without a major structural catalyst.
Final thought
Chainlink’s price trajectory through 2030 is closely tied to Bitcoin’s broader market cycles. In the near term (2026), LINK is at a critical juncture near its 200-day EMA — a decisive breakout could push it toward $15, while rejection may drag it down to the $7 support zone.
The medium-term outlook (2027-2028) looks more constructive, riding on an anticipated Bitcoin bull run that could lift LINK by 3x-4x, followed by a consolidation phase where dips may present buying opportunities rather than trend reversals.
The later years (2029-2030) hinge on whether Bitcoin’s bear-market bottom forms on schedule. If the cycle holds, LINK could see a strong 5x-6x rally in 2030; if not, the bearish trend may persist.
Overall, Chainlink’s long-term prospects remain closely coupled to Bitcoin’s four-year cycle pattern, making BTC’s price action the key variable to watch for LINK investors.
Can Chainlink reach new highs by 2027?
LINK’s 2027 outlook is bullish, largely driven by an anticipated Bitcoin bull run following a bottom formation above $60K. If this plays out, LINK could see returns in the range of 3x to 4x.
What factors could cause Chainlink’s price to drop in the coming years?
Bearish scenarios include failure to break the 200-day EMA in 2026, profit booking by investors in 2028, and Bitcoin retracements causing selling pressure on LINK in 2029.
What is the long-term Chainlink price prediction for 2030?
If a Bitcoin bear-market bottom forms by the end of 2029 and the bull cycle repeats, LINK could see a strong rally of 5x to 6x in 2030. However, if the bottom fails to form, the bearish trend may continue.