

Gold fell to a three-week low this week as a fresh round of military exchanges between the United States and Iran pushed oil prices higher, lifted bond yields, and revived a scenario that few investors had priced in a month ago: a Federal Reserve rate hike in September.
Spot gold slipped to roughly $4,304 an ounce in early Asian trade on Wednesday, its weakest level since August 7, extending a losing streak to four consecutive sessions. December gold futures on Comex fell as much as 1% to around $4,350. By the end of the day the metal had staged a partial recovery, bouncing more than 1% to about $4,374 as the dollar and Treasury yields eased off their highs, but the underlying pressure on the gold price has not gone away.
The move is a striking reversal for a metal that gained roughly 10% in August, its best month since January. In the space of two weeks, the gold price has gone from riding a wave of easier-policy optimism to fighting a hawkish Fed, a firmer dollar, and a geopolitical shock that counter intuitively is hurting rather than helping bullion.
Why is a Middle East crisis pushing gold down, not up?
Gold is usually the first place investors run when missiles start flying. So why is the gold price falling as the US-Iran conflict flares up again?
The answer lies in the transmission channel. On Tuesday the US carried out a barrage of airstrikes on Iranian targets, the most serious escalation in weeks, and Iran retaliated with ballistic missile strikes of its own. That immediately raised fears of disruption to shipping through the Strait of Hormuz, through which a fifth of the world’s oil passes. Brent crude jumped for a third straight session, trading in the mid-$90s.
Higher oil means higher inflation. Higher inflation means the Federal Reserve is less able to cut rates and more likely to raise them. And higher interest rates are the single biggest headwind for gold, because bullion pays no yield. When cash and bonds offer more, the opportunity cost of holding gold rises.
In other words, this particular crisis is being read by markets as an inflation shock rather than a growth shock. Growth shocks send investors into gold. Inflation shocks, at least when the central bank is willing to respond aggressively, send them into the dollar and short-dated Treasuries instead. That is exactly what has happened this week.
The Fed has turned hawkish, and markets believe it
The bigger story behind the gold price slide is a repricing of the Federal Reserve.
At the Jackson Hole symposium last week, Fed Chair Kevin Warsh signalled that the central bank may need to raise rates if inflation does not cool. That was reinforced on Tuesday by Fed Governor Michael Barr, who said that if price pressures fail to moderate, it will be time to hike, noting that inflation has now run above the Fed’s 2% target for more than five years.
Markets have taken the message seriously. According to the CME FedWatch tool, traders are now pricing in roughly a 70% probability of a 25-basis-point increase at the September 15–16 FOMC meeting. A month ago, the debate was about whether the next move would be a cut. Today it is about whether the Fed will hike once or twice before year-end.
That shift has rippled through every rate-sensitive asset. The 10-year Treasury yield has climbed toward 4.8%, the 30-year has pushed back above 5.28%, and the US Dollar Index has firmed near 99.7. Each of those moves makes gold less attractive: higher yields raise the cost of holding a non-yielding asset, and a stronger dollar makes dollar-priced gold more expensive for buyers in India, China, Europe, and the Middle East, which together account for the bulk of physical demand.
Giving Back the Secretary Bessent Bounce
Some context helps explain why the gold price has been so volatile. On August 19, Treasury Secretary Scott Bessent announced an expanded program of Treasury bond buybacks. The move pushed long-dated yields sharply lower, weakened the dollar, and triggered a powerful rally in gold. Bullion surged roughly 10% over the month, one of its strongest performances of the year.
That rally has now been almost entirely unwound. Yields have reversed back to their pre-announcement levels as inflation worries and rate-hike expectations overwhelmed the technical support from Treasury buybacks. Gold, which had priced in a friendlier rate environment, has had to give the gains back.
The lesson for investors is that August’s rally was built on a specific assumption that lower long-end yields would persist and that assumption has been tested and broken by the combination of oil, Iran, and a hawkish Fed.
Gold price analysis over a weekly timeframe
At press time, Gold was trading at $4423.83 with an intraday gain of 0.81%. Gold price has experienced selling pressure from the $4,700 zone. Amid this fall, the price has eroded over the previous three weeks’ gain. The chart structure suggests that the price has grabbed the liquidity from the three-week low amid this global news and has climbed by 3.30% in less than 2 days.
Suppose any positive news circulates in the financial market; buyers might bounce back and can cover these losses. Here, any positive news for Gold could work as a catalyst because of the liquidity sweep from the three-week low. Once the price manages to close over the $4900 level, buyers might eye a new all-time high.
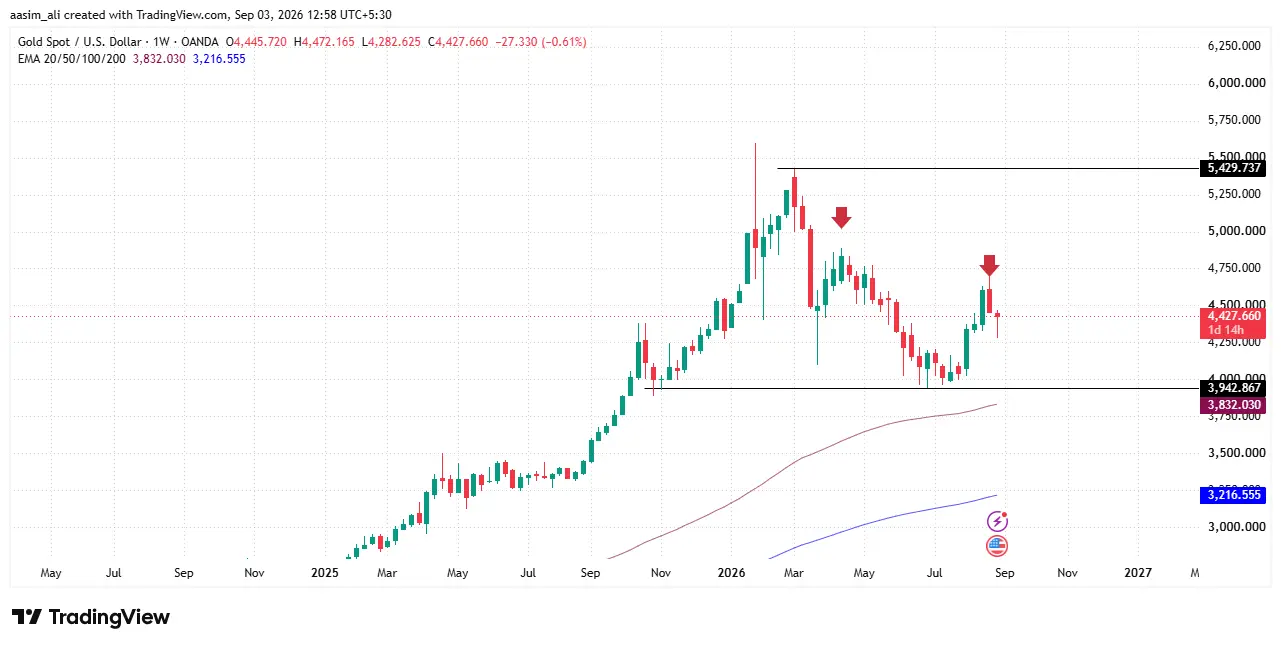
The chart structure displays that the gold price has been falling by forming lower lows and lower highs on a weekly timeframe. In the last week of August, the gold price was trading in the lower high zone, and this global news circulated in the financial market. This news has impacted the price negatively and has pulled the price by 3.22% in that week.
Furthermore, the next week seems to close in negative, which might create a panic situation among buyers. If sellers remain stronger, the price might trigger a bearish trend on a weekly time frame and can form a lower low below the recent swing low of the $3940 level.
Technical Damage: The 200-Day Moving Average Breaks
From a chart perspective, the most important development this week is that the gold price has fallen below its 200-day moving average on a daily timeframe, a level that traders and algorithmic funds watch closely as a dividing line between bull and bear regimes.
Gold had held above the 200-day average for most of the year. Losing it, and then failing to reclaim it during Wednesday’s bounce, invites further technical selling. Momentum funds that use trend-following signals typically reduce long exposure when this level breaks, and options dealers who were positioned for higher prices are now forced to hedge in the opposite direction.
Analysts are watching two levels. To the downside, an immediate support level of around $4,300 could be the first line of defense; a decisive close below it would open the door to a deeper correction toward the low $4,000s. To the upside, a recovery back above the 200-day moving average and the $4,400 handle would suggest the four-day sell-off was a positioning flush rather than the start of a new downtrend.
Silver, platinum, and palladium follow gold lower
The weakness has not been confined to gold. Spot silver dropped about 1% to around $63.60 an ounce, platinum eased a similar amount to roughly $1,722, and palladium lost 1.4% to about $1,292. Silver, which has both monetary and industrial characteristics, has been hit twice: once by the rate hike repricing that is hurting gold and again by concerns that higher oil and higher borrowing costs will slow industrial demand.
|
Metal |
Price | Recent performance | Risk profile |
Take |
| Silver Futures (SI) |
$65.52 |
+57.61% 1Y
-8.31% YTD |
High volatility |
Best balanced choice |
| Platinum Futures (PL) |
$1,762.35 |
+24.89% 1Y
-14.80% YTD |
Scarcity and cyclical risk |
Contrarian alternative |
| Palladium Futures (PA) |
$1,360.25 |
+17.94% 1Y
-18.11% YTD |
Narrower, more speculative |
Satellite position only |
The synchronized decline across precious metals confirms that this is a macro-driven move dollar and rates rather than anything specific to gold supply or demand.
All eyes on Friday’s Jobs Report
The next major catalyst for the gold price is US labor market data. The ADP private payrolls report was due on Wednesday, followed by the far more important nonfarm payrolls release on Friday.
The dynamic is simple. A soft jobs number would ease pressure on the Fed to hike, pull yields lower, and give gold room to recover. A strong number or a hot wage figure would cement expectations for a September increase and could push gold toward that $4,300 support and beyond.
Traders will also be listening for any further Fed commentary in the days before the central bank enters its pre-meeting blackout period. Another hawkish speech in the mold of Barr’s remarks would weigh on gold; any hint that the Fed sees the oil spike as transitory would help.
What does this mean for Indian gold buyers?
For buyers in India, the world’s second-largest consumer of physical gold, the international correction arrives just ahead of the festive and wedding season, when demand traditionally peaks.
Domestic gold prices track the international gold price adjusted for the rupee exchange rate and import duty. A weaker global price is helpful, but a stronger dollar partly offsets it by pushing the rupee lower, so the fall in local prices is typically smaller than the fall in dollar terms. Jewellers report that dips of this kind usually bring a burst of retail buying, particularly when they coincide with the run-up to Navratri, Dhanteras, and Diwali.
The practical takeaway for Indian households is that a three-week low after a 10% monthly rally is a modest pullback, not a crash. Those who buy gold in a staggered way through SIP-style monthly purchases, sovereign gold bonds when available, or digital gold are best placed to take advantage of volatility without trying to time the exact bottom.
The Bull case has not disappeared.
It is worth stepping back from the daily noise. Even at $4,300, the gold price is up substantially on the year and remains close to record territory. The structural drivers that took it there, central-bank buying, de-dollarization by emerging-market reserve managers, persistent fiscal deficits in the US and Europe, and geopolitical fragmentation have not changed because of one hawkish Fed speech.
There is also a scenario in which the Iran conflict flips from a gold negative to a gold positive. If the fighting escalates to the point where it threatens global growth rather than just inflation, a sustained closure of the Strait of Hormuz, for instance, markets could shift from pricing rate hikes to pricing recession, and gold would likely surge. The metal’s behavior this week reflects a market that currently sees a contained conflict with inflationary side effects. That assessment can change quickly.
Finally, a Fed hike is not yet a done deal. A 70% probability still leaves meaningful room for the central bank to hold, particularly if Friday’s payrolls disappoint. Should the Fed decide that oil-driven inflation is not something it should fight with tighter policy, the entire rate-hike premium currently weighing on gold could evaporate.
The Bear Case: Higher for longer, again
Against that, the risks are real. If the Fed does hike in September and signals more to come, real yields, the true cost of holding gold would rise further. A dollar index pushing back above 100 would add to the pressure. And with gold having broken its 200-day average, technically driven selling could accelerate any fundamental weakness.
Positioning is a further concern. August’s rally attracted a large speculative long build-up in gold futures. Some of that has been flushed out over the past four sessions, but if more longs are forced out on a strong jobs number, the decline could overshoot fair value in the short term.
Bottom Line
The gold price has been caught in a rare configuration where a Middle East war is hurting rather than helping bullion, because the market is treating the conflict as an oil-and-inflation story that pushes the Fed toward tightening. Until either the oil spike fades or the Fed backs away from rate hikes, gold is likely to trade heavily. But with prices still near historic highs and the structural bull case intact, this week’s three-week low looks more like a correction within a bull market than the beginning of its end.
This article is for informational purposes only and does not constitute investment advice. Gold prices are volatile; consult a qualified financial adviser before making investment decisions.