

Bitcoin price has undergone a correction phase after a bullish trend. A golden crossover was seen between the 100-days and 200-days EMA on a daily timeframe. Continuous growth was spotted in the trading volume and OI has also increased. BTC price has experienced a retracement of around 8.80% and finding its floor for a bullish move.
Bitcoin price fundamentals: ETF flows and institutional demand
US spot Bitcoin ETFs took in about $241 million in the week ending October 2, their third straight week of inflows, with total net assets near $108.9 billion. The trend reversed during October 5-9, when the funds saw about $679 million in outflows. Demand returned on October 13, with roughly $175.6 million in net inflows.
Long-term holders are also accumulating. Sentiment data shows wallets holding 100 to 1,000 BTC added about 113,950 BTC between mid-July and late September. Even so, Bitcoin remains roughly 32% below its October 2025 peak (that figure dates from early October), so ETF demand needs to stay positive to support a move above $87,000.
US inflation data: CPI and PPI
US consumer prices rose 3.7% year-on-year in September, up from 3.4% in August and above forecasts. Monthly CPI rose 0.6%, driven largely by energy, and core CPI rose 0.3%, above the 0.2% expected. Bitcoin sold off alongside stocks after the report, as hotter inflation raises the odds of further Fed rate hikes.
Producer prices were even stronger. The September PPI rose 1.3% from the previous month, the sharpest increase since March 2022, and 6.3% year-on-year. Final demand energy prices jumped 10.8%. Because producer costs often pass through to consumers, this could keep inflation elevated.
Persistent inflation may keep interest rates high and weigh on risk assets like Bitcoin. The next CPI report is due on November 10. The next PPI report is due on November 13.
Bitcoin price overview
At press time, BTC was trading at $82,755.00 with an intraday gain of 1.20%. Its market capitalization was $1.663T and the 24-hour trading volume was $26.466B. Its circulating and total supply is 20.099M while the maximum supply is 21M. BTC dominance has increased by 2.40% to 60.57% in October.
Bitcoin price technical analysis over 1-D timeframe
Bitcoin price has been in a bullish trend since July and has surged by 40%. Amid this bullish trend, the BTC price has exceeded the key moving averages which showcases the bulls’ domination.
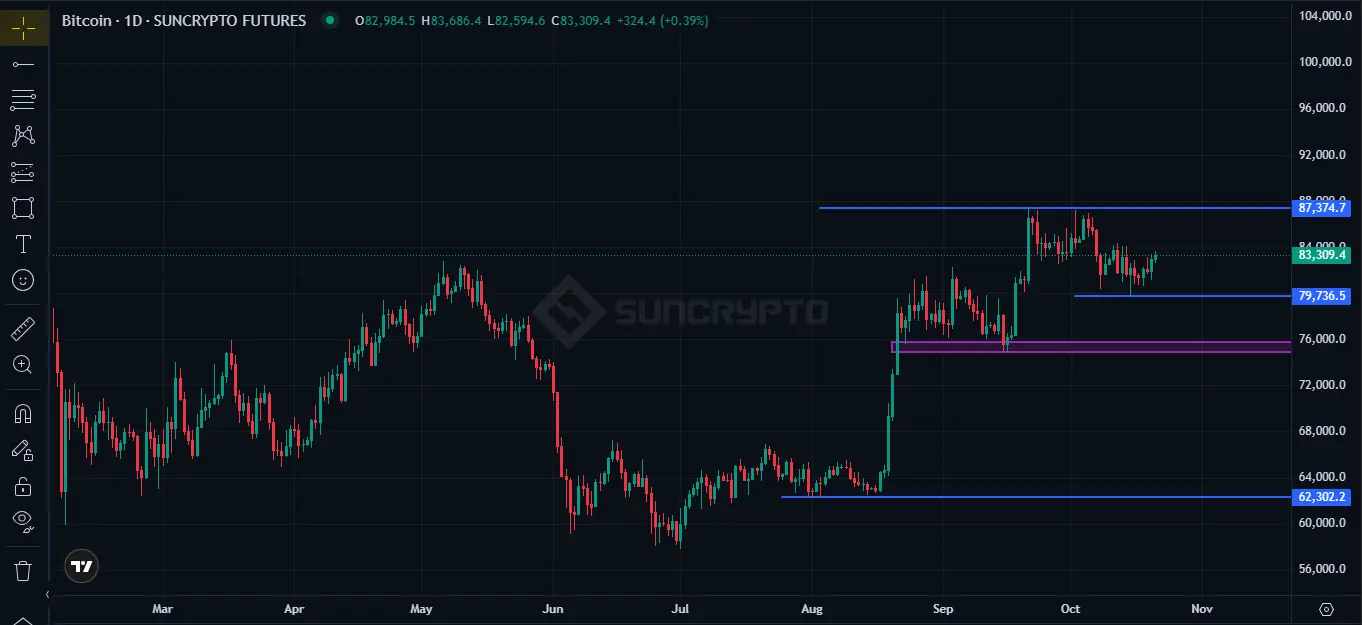
The technical chart suggests that the Bitcoin price is struggling to surpass the $87,000 level. If Bitcoin price manages to exceed this level and a daily candlestick closes over this level, it could be a bullish sign. If the breakout of this level comes with a rise in volume then a bullish trend can be observed. The immediate resistance during this bullish momentum could be $90,000. If the price surpasses this level too, buyers could push the price to $97,000.
Conversely, if Bitcoin price slips below the immediate support level of $79,770 then profit booking scenario can be generated. Once the BTC price sustains below this level, the price can drop to a strong support zone of $75,000.
Bitcoin price prediction: What price, funding rate and open interest data suggest
Bitcoin is trading around $83,425, up 0.25% on the hourly chart, after spending the past several days in a $81,000 to $83,000 range. Price is now pushing against the upper end of that range, with a recent high near $83,700 acting as immediate resistance.
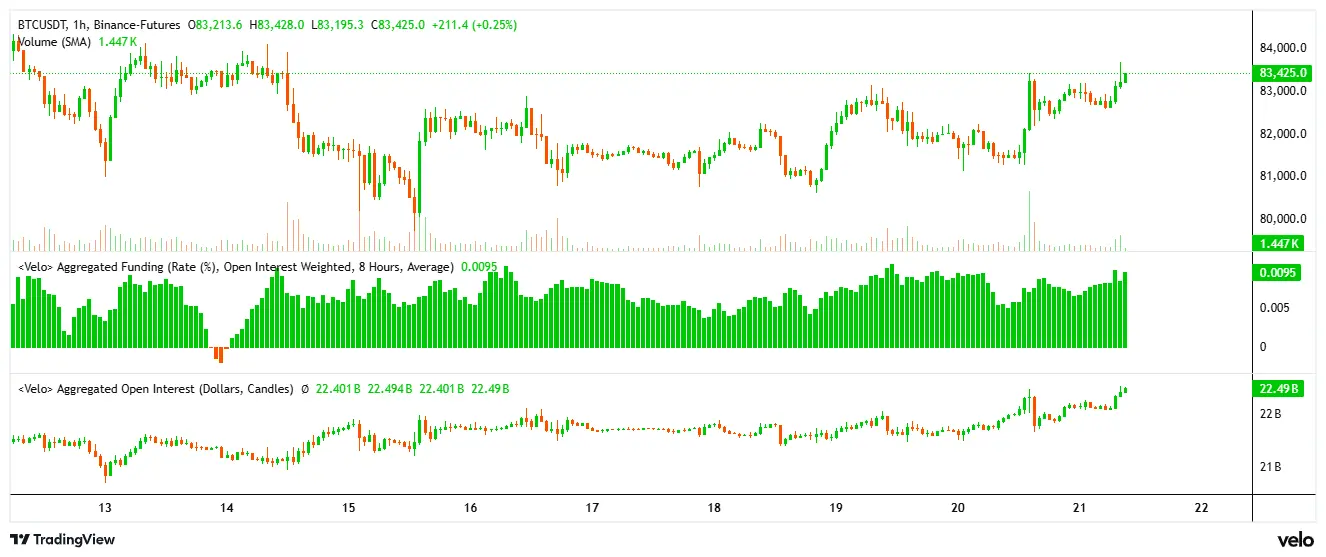
Derivatives data supports the move. Aggregated open interest has climbed from roughly $21 billion to $22.49 billion, indicating fresh positions are entering the market rather than the rally being driven purely by short covering. Funding rates, weighted by open interest, sit at 0.0095%. That is positive but modest, suggesting long traders are paying a premium without the market looking excessively overheated.
If Bitcoin closes decisively above $84,000 on strong volume, the next target could be the $85,000 region. Failure to hold above $83,000 may send the price back toward $82,000 and $81,000 support. Rising leverage also raises the risk of a sharp long squeeze if momentum fades.
BTC price outlook: What the derivatives data says
Bitcoin is trading around $82,800, consolidating in a tight $80,000-$84,000 range after its September rally to roughly $87,000. Derivatives data suggests the market is waiting for a decision.
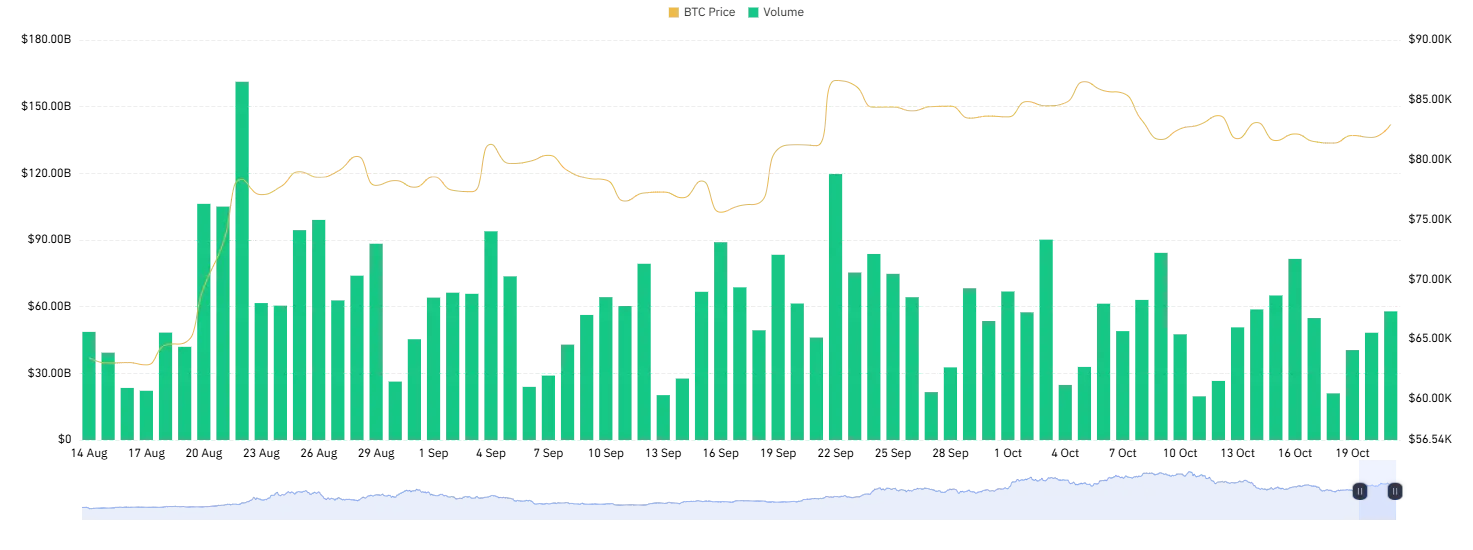
Aggregated funding rates are at about 0.0077%. They have stayed positive for months, which shows traders are leaning long, but they are well below the 0.01% peaks, so the market doesn’t look overheated. Open interest is around $22.1 billion, down from the September high near $24 billion. That means leverage is not building and the speculative froth has cooled.
Flat price, steady OI and mild positive funding point to a healthy consolidation. A daily close above $87,000 could open the way toward $90,000. A drop below $80,000 could trigger long liquidations and a move toward $75,000.
Final Thought
Bitcoin is consolidating in a tight $80,000-$84,000 range after the September rally to around $87,000. Both the technicals and the derivatives data point to a market that is waiting for a decision rather than one that is overheated.
On the positive side, the daily chart shows a golden crossover, price holding above 200-days EMA, and a 40% gain since July. Open interest has risen to roughly $22 billion, and funding rates are positive but modest (about 0.008–0.0095%). This suggests fresh long positions are entering without excessive leverage.
The key levels are:
- Bullish case: A daily close above $87,000 on rising volume could open the way to $90,000, and then $97,000.
- Bearish case: A break below $80,000 could trigger long liquidations and a slide toward $75,000.
Can Bitcoin break above $87,000?
It’s possible, but BTC has struggled to clear this level so far. A daily candle close above $87,000, backed by rising volume, would be a bullish sign. The next targets after that are $90,000 and then $97,000.
What are the key support levels for Bitcoin?
The immediate support is $79,770, and a slip below it could trigger profit booking. If BTC sustains below this level, the next strong support zone is $75,000.
What do funding rates and open interest say about the market?
Funding rates are positive but modest, at about 0.008% to 0.0095%. Open interest has risen to roughly $22 billion. Together, these suggest fresh long positions are entering without excessive leverage, so the market doesn’t look overheated.