

OP price has remained volatile for the past few days and has surged by 21.22% on 13th October. It has triggered a breakout from a descending trendline on a daily timeframe. Optimism (OP) price has exceeded the key moving averages on a daily timeframe which showcases the bulls’ grip. The trading volume and OI has increased dramatically with the price. Let’s discuss how these data can impact the OP price further.
Key Functions of the OP Token
- Governance (Token House): OP holders vote on protocol upgrades, network parameters, treasury fund allocations, and ecosystem incentives within the Token House (one of the two houses of the Optimism Collective).
- Ecosystem Participation: It coordinates community-led funding and votes alongside the Citizens’ House to shape public goods and long-term development.
- Economic Alignment: A portion of net Superchain sequencer revenue is tied to OP token buyback programs to support the network economy.
Optimism price overview
At press time, OP coin was trading at $0.153 with an intraday gain of 10.20%. Its market capitalization was $352.791M and the 24-hour trading volume was $228.707M. Its circulating supply is 2.3B OP and the total supply is 4.295B OP.
OP price technical analysis over 1-D timeframe
OP price has been in a consolidation phase on a wider timeframe since March 2026 after a bearish trend. Since mid August, buyers have shown interest and have pushed the price by more than 80%.
If buyers remain confident and the price triggers a breakout from the $0.170 level, bullish momentum can be seen. If the trading volume and OI increased during the breakout then the momentum can last longer. If the whales show interest in OP, the trend can flip to bullish.
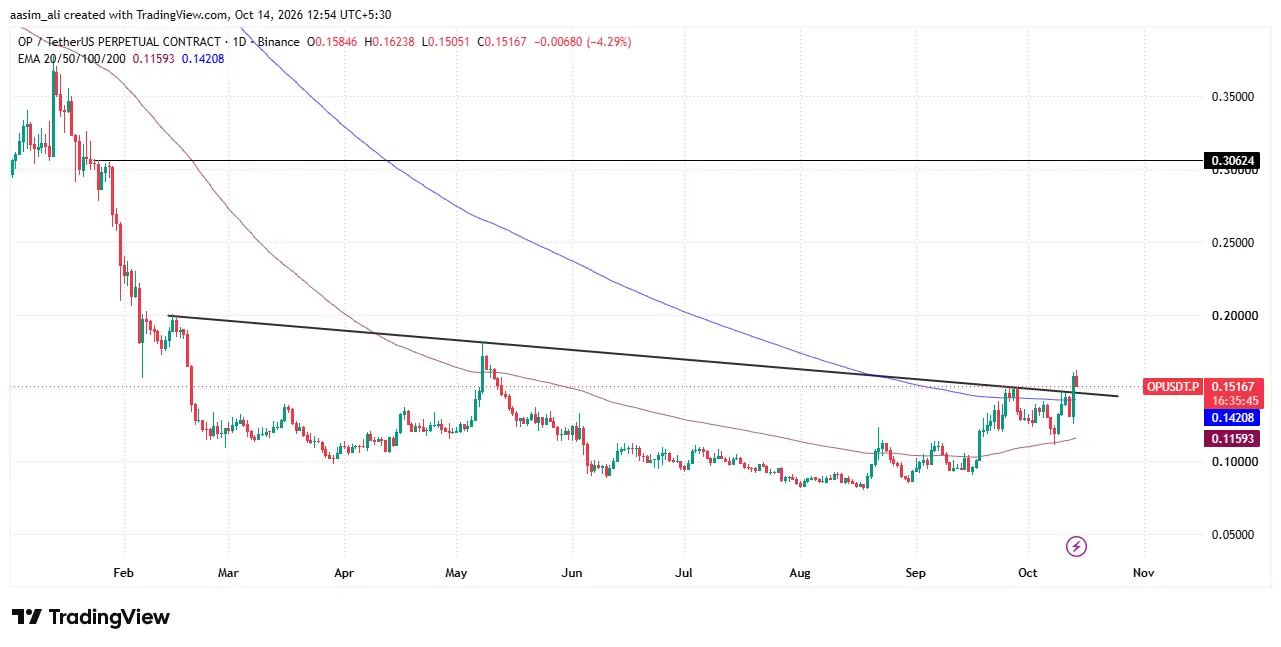
On the other hand, if the price faces resistance from the $0.170 level then buyers might lose the momentum. Once the price slips below the 200-days EMA on a daily timeframe, buyers might panic and a bearish momentum can be observed.
OP price prediction: What volume is telling us
Optimism is showing strong momentum. Its price climbed from roughly $0.087 in early September to nearly $0.158 by 14 October. Volume is the standout: trading activity surged to around $390 million in the latest session, the highest in the whole period. An earlier spike near $287 million on 11 October came just before a sharp rally.
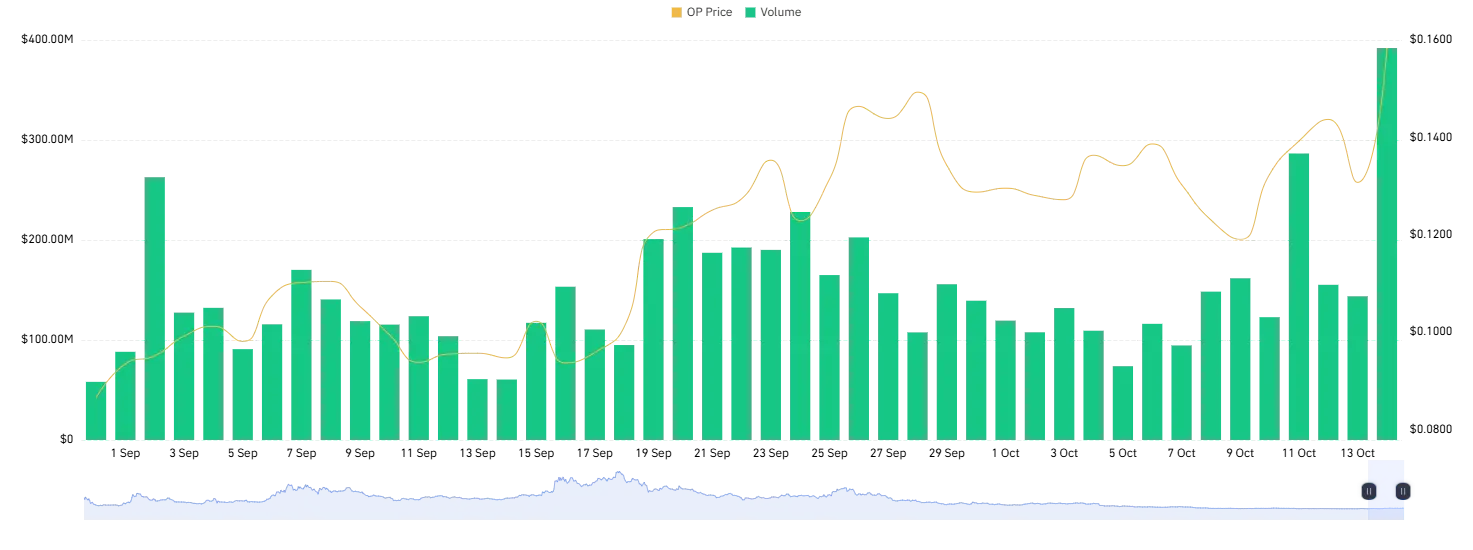
A rising price backed by rising volume suggests real buyer conviction rather than a thin, speculative move. OP price has also broken above its late-September high near $0.149, which could now act as support. If volume stays elevated, the next target could be the $0.17-$0.18 zone.
However, a volume spike at a local peak can also signal exhaustion. If price falls below $0.145 while volume fades, a pullback toward $0.128-$0.13 is possible.
OP Price Prediction: Rally Meets Rising Leverage
Optimism is trading near $0.1532 after a sharp rebound from the $0.126 low on October 13, pushing as high as $0.1625 before a small pullback. What stands out is the surge in open interest, which climbed from roughly 310M to over 380M OP in a day. That signals fresh leveraged positions entering the market, not just short covering.
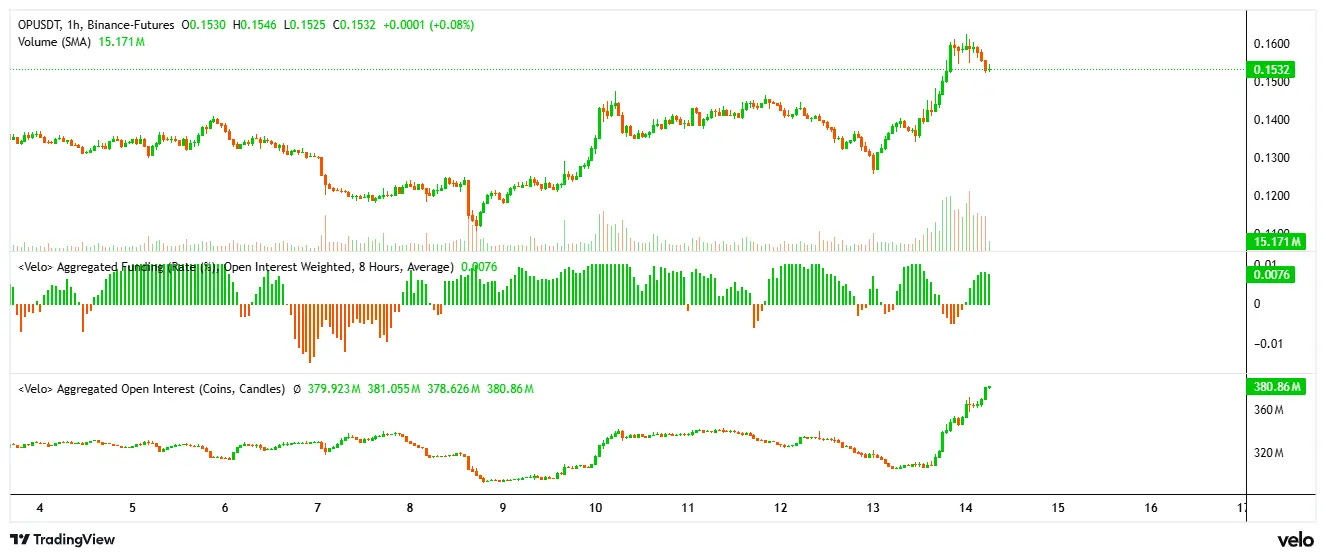
Funding rates are mildly positive at 0.0076%, so longs are leading but the market isn’t yet overheated. If buyers defend the $0.145-$0.150 zone, OP could retest $0.160-$0.165, and a clean breakout may open the way toward $0.175. However, rising OI paired with a cooling price raises liquidation risk. A drop below $0.140 could trigger a long squeeze and send the price back toward $0.130. Traders should watch funding and volume closely for confirmation.
Final Thoughts
OP has broken out of its descending trendline and reclaimed key moving averages, with price rising from about $0.087 in early September to around $0.153. Surging volume and open interest suggest genuine buyer participation rather than a thin move.
The key level is $0.170. A clean breakout above it, backed by rising volume and OI, could open the way toward $0.175-$0.180 and confirm a bullish trend flip. On the downside, bulls need to defend the $0.145-$0.150 zone. A fall below $0.140 on fading volume could drag price back toward $0.128-$0.130, and a slip under the 200-day EMA would weaken the bullish case.
The main risk is leverage. OI has climbed sharply, so if price cools while OI keeps rising, a long squeeze becomes possible.
Why did the OP price surge on 13th October?
OP price jumped 21.22% after breaking out of a descending trendline on the daily chart. The rally was backed by a sharp rise in trading volume and open interest, which points to fresh buyer participation.
What is the key resistance level for OP price right now?
The key resistance is $0.170. A clean breakout above it, supported by rising volume and OI, could open the way toward $0.175-$0.180.
What are the important support levels for OP?
Bulls need to defend the $0.145-$0.150 zone. If price falls below$0.140-$0.145 on fading volume, a pullback toward$0.128-$0.130 is possible.