

GIGGLE coin price has remained in a bearish trend since November 2025. Amid this bearish trend, investors have lost 86% of their invested capital. However, the price has surged by 90% in the last 2 days of July 2026 and the investors are still in loss. The recent bullish move has the potential to reverse the trend and lift the price to $100 mark. Let’s explore how the price can perform further.
Giggle coin price overview
At the time of writing, Giggle Fund (GIGGLE) price was trading at $35.31 with an intraday loss of 18.44%. It has a market capitalization of $33.84M and the 24-hour trading volume of 60.85M.
The trading volume is almost 2x of the market capitalization which shows the increased activity of traders and investors. The increased activity of traders and investors may lead to a great change in its price.
Liquidation heatmap (24 hour) for GIGGLE coin
GIGGLE’s liquidation heatmap shows a sustained downtrend from roughly $47.5 to $33 between August 3, 11:30 and August 4, 10:15. Dense yellow-green liquidation clusters near $45 and a particularly thick band around $41–42 mark zones where heavy leveraged positions were stacked, both of which price sliced through as it fell. Each leg down triggered fresh liquidation clusters slightly below the prior support, showing cascading long liquidations fueling the decline.
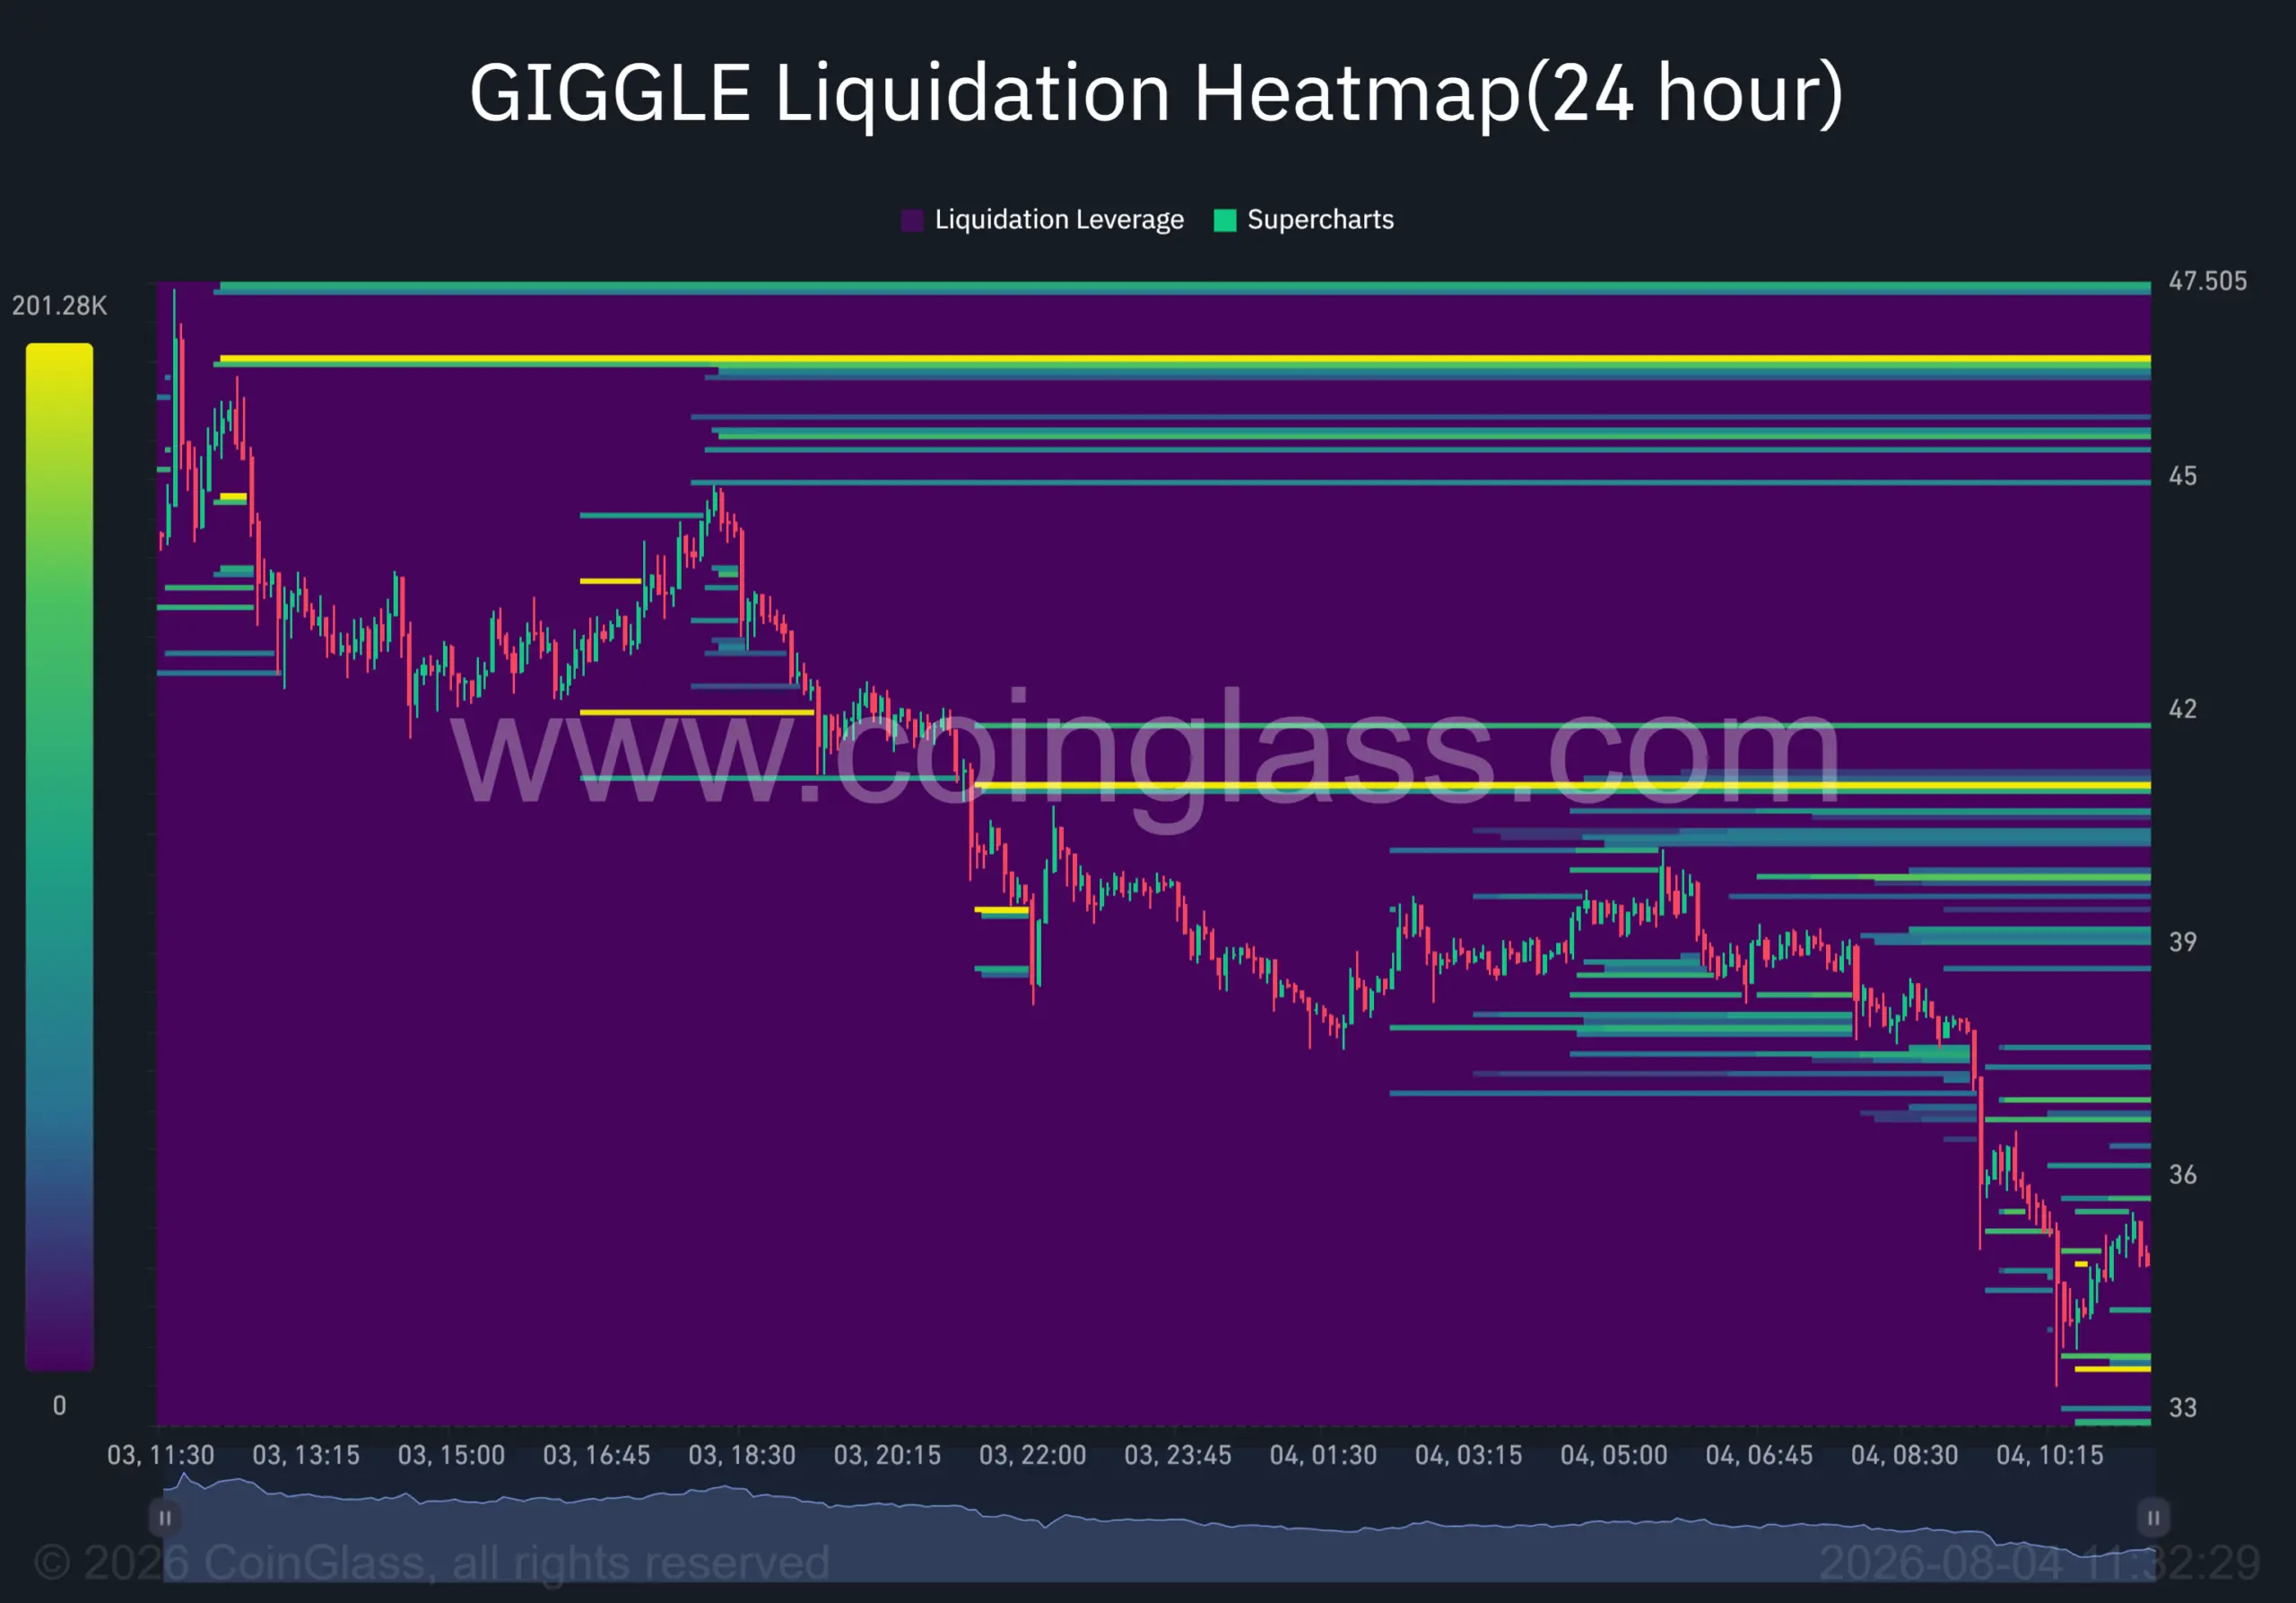
The most intense recent activity sits near the current price around $33–34, suggesting fresh leverage building at these lower levels. Overall, the heatmap reflects a strong bearish structure with repeated long squeezes.
GIGGLE price prediction for 2026
The GIGGLE coin has dropped by 28% in just 4 days after the recent bullish trend. Amid this fall, the price has slipped below the 200-days EMA on a daily time frame. However, it is still defending the 100-days EMA which depicts that buyers are still in the game.
Suppose the price manages to defend the 100-days EMA on a daily timeframe, buyers may remain stronger. Any bullish candlestick pattern on the 100-days EMA can lift the price to the 200-days EMA.
If the Giggle Fund price surpasses the 200-days EMA and holds above then a bullish trend can be seen. If the bullish momentum matches with the trading volume then the price can jump to the $100 mark in the next few months.
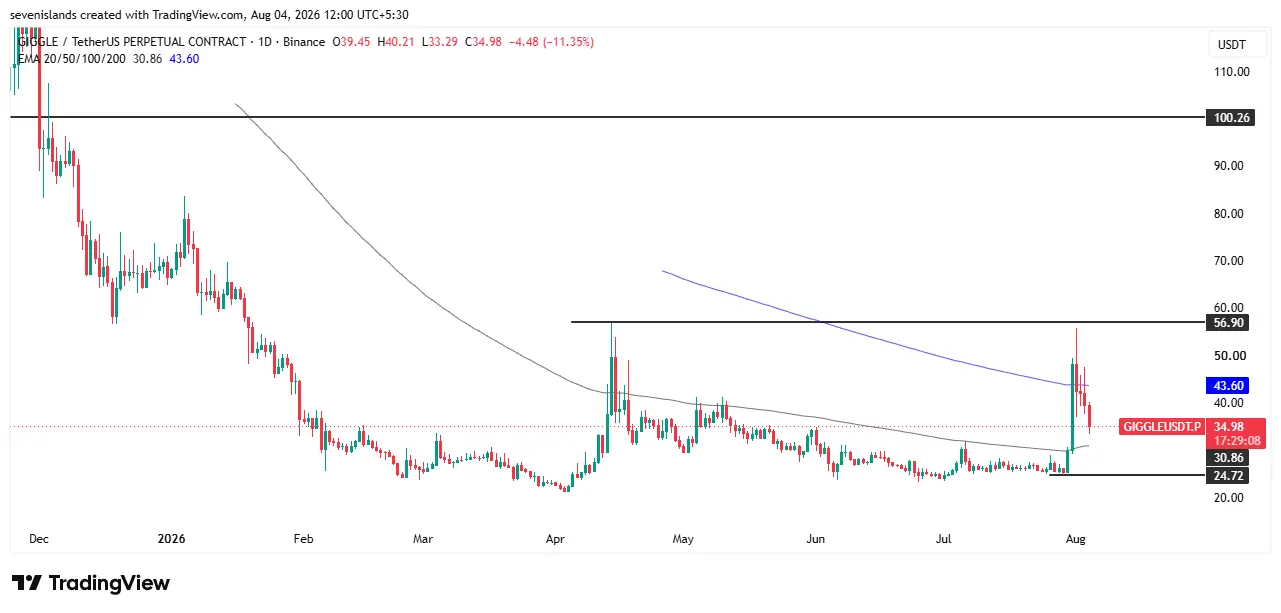
On the other hand, if the GIGGLE coin price dives below the 100-days EMA then buyers may lose the momentum. If the GIGGLE coin price holds below the 100-days EMA, sellers may lead the trend. Amid this bearish trend, the price can melt to an immediate support level of $24.72.
Once the price fails to defend the immediate support level of $24.72, the price may drop to the $20 level. If the price loses this level then it could be difficult for buyers to bounce back and a long term bearish trend can be seen.
GIGGLE coin price prediction for 2027
The price has formed a descending triangle pattern on a daily timeframe. Furthermore, the price had triggered a breakout and has performed well. After the breakout, a small profit booking has been seen. This profit booking can turn into a pullback and a bullish trend can be seen.
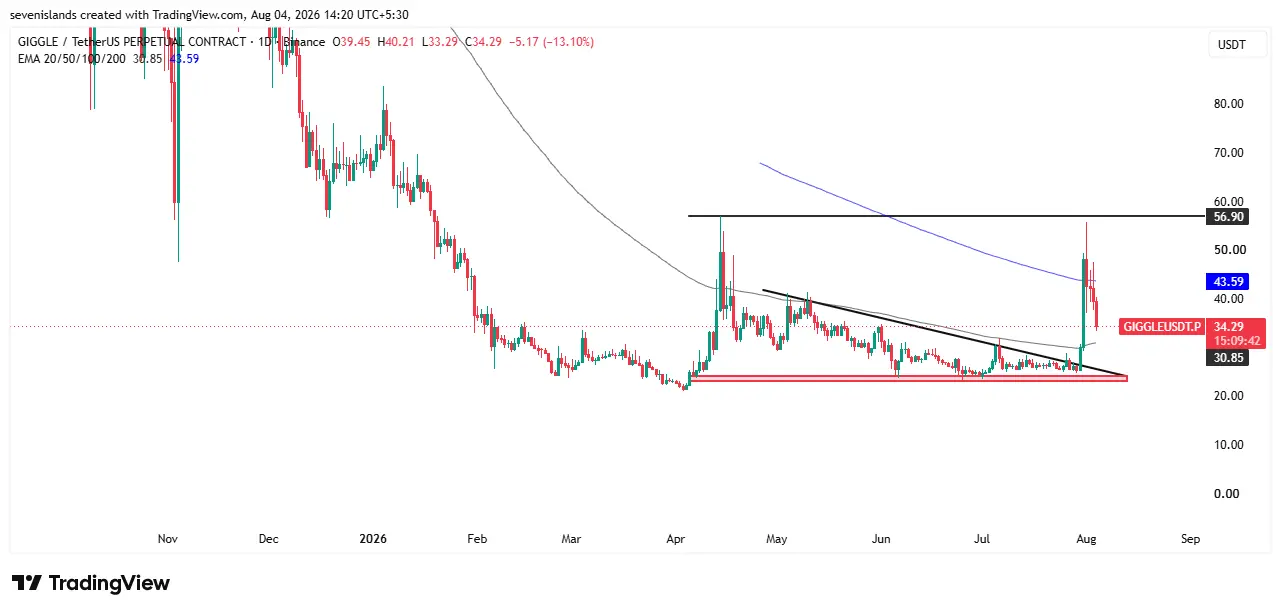
Conversely, if the profit booking comes in large numbers then buyers may lose the control and a bearish trend can be anticipated.
Giggle price prediction for 2028
Giggle crypto price has formed a double-bottom pattern on a weekly timeframe. As it formed a double-bottom pattern, it has gained a bullish momentum. If buyers remain confident, the price may keep rising and it may exceed the psychological level of $100.
On the other hand, the price has failed to sustain over the $50 level and trading below $35. The recent bearish momentum suggests that this could be a pump and big players have started profit booking. The profit booking can result in a bearish trend and the price may soon start trading below the $20 level.
GIGGLE coin price prediction for 2029
Based on the technical chart, the price is still trading over a strong support zone of $25. Buyers would be in control until the price is trading over the $25 level. Once the price slips below the $25 level, sellers would lead the trend and it would be difficult for buyers to bounce back.
GIGGLE coin price prediction for 2030
Giggle Fund price has failed to touch the previous swing high of $56.87 on monthly timeframe. The chart structure suggests that the liquidity over the previous swing high has not been grabbed. So there is a possibility that the price might claim a bullish move.
Final Thoughts
GIGGLE coin’s path to $100 hinges on a battle at the 100-day EMA. The 90% rally in late July showed genuine buying interest, but the sharp 28% pullback and drop below the 200-day EMA signal that momentum has cooled faster than conviction has built.
The liquidation heatmap adds weight to caution here, cascading long liquidations from $47.5 down to $33 show leveraged buyers have been repeatedly squeezed on the way down, and fresh leverage stacking near the current $33–34 zone means another dip could trigger a similar cascade rather than a clean bounce.
For the bulls, defending the 100-day EMA is the immediate test. A reclaim of the 200-day EMA on strong volume would be the first real signal that the downtrend is losing control, opening the door toward higher levels over the coming months. But a break below the 100-day EMA would likely hand momentum back to sellers, with $24.72 as the next support to watch.
Given the 86% drawdown investors are still sitting on since November 2025, the $100 mark remains a longer-term possibility rather than a near-term certainty, one that depends on sustained volume-backed strength above the 200-day EMA, not just a short-lived relief rally. Traders should watch price action around the 100-day EMA closely in the coming sessions, as it will likely decide the next major move.
Can GIGGLE coin price reach $100?
GIGGLE coin price can reach the $100 mark if it holds above the 100-day EMA, breaks past the 200-day EMA with strong volume support, and sustains bullish momentum over the coming months.
What is the immediate support level for GIGGLE coin?
If GIGGLE coin price slips below the 100-day EMA, it may fall toward the immediate support level of $24.72.
Why is the GIGGLE coin price falling despite the recent rally?
GIGGLE coin price fell 28% in four days after its 90% surge due to profit booking and cascading long liquidations, as shown in the liquidation heatmap between $47.5 and $33.