

The Ethereum price has been in a bullish trend since July and surged by roughly 75% till late September. Since late September, the ETH price has undergone a correction phase of 22.43%. The price has surged by 5.22% from its recent low but if this buying pressure increases, then the correction phase can end here. Amid this bullish move, the funding rate has also increased, which might be a bullish sign. Let’s connect these dots and predict the ETH price forecast.
Ethereum fundamentals: What supports the long-term case
Beyond the charts, Ethereum’s fundamentals continue to support its long-term value. ETH remains the leading smart contract network, hosting most of the decentralized finance activity, stablecoin issuance and tokenized real-world assets in the market. This steady demand for blockspace keeps network usage and fee generation meaningful even during price corrections. Staking is another key pillar. A large share of the 122.183 million ETH circulating supply is locked in staking contracts, which reduces the amount available on exchanges and limits immediate selling pressure.
Since the Merge, supply growth has also been far lower than before, and during periods of heavy activity, fee burning can make ETH close to neutral or even deflationary. Institutional adoption adds further weight, as spot ETH exchange-traded products and corporate treasury interest give larger investors regulated access to the asset. Meanwhile, ongoing protocol upgrades and the growth of Layer 2 networks aim to improve scalability and lower costs. However, fundamentals rarely drive short-term price action. Weak sentiment, thin volume and falling open interest can still keep ETH range-bound until a catalyst appears.
Ethereum price overview
Ethereum price was trading at $2,288.00 with an intraday gain of $0.80. Its market capitalization was around $279.583B, and its 24-H trading volume was $7.948B. Its circulating and total supply is 122.183M ETH.
Ethereum price technical analysis over 1-D timeframe
The overall trend in ETH is bullish but it has experienced a correction phase since late September. Ethereum investors have experienced a tough time in October and their invested value has decreased by 15.92%. Ethereum price was rising slowly in November, which might be a bullish sign.
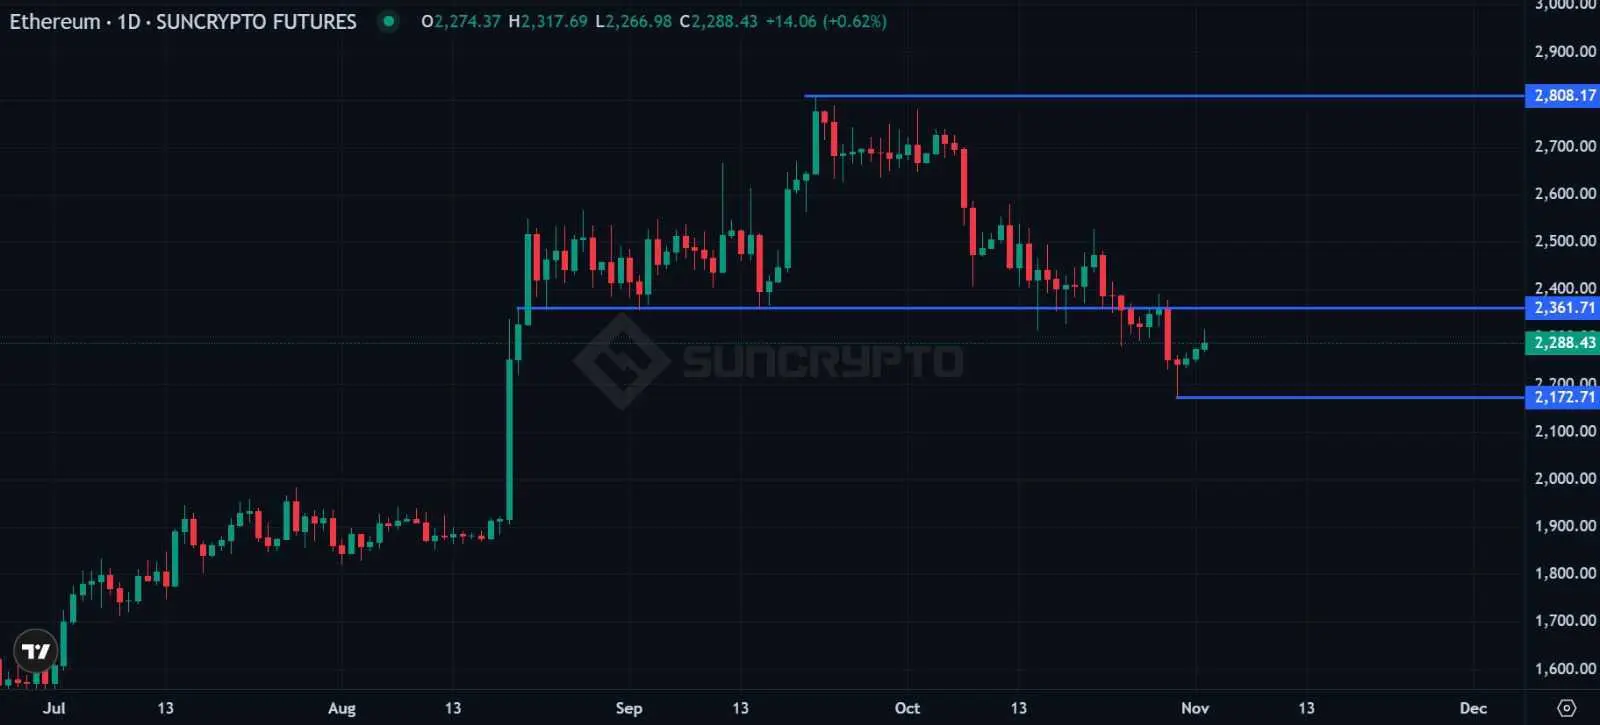
Source: ETH/USDT price chart over 1-D timeframe by SunCrypto
During the October fall, the price has dropped below a major support level of $2,360. It was holding below this level, which might have put buyers in trouble. If the price holds below this level, sellers may dominate further.
Conversely, if the Ethereum price bounces back and starts trading over this level, then buyers could become stronger. Once a daily candlestick closes over the $2,360 level, this correction phase could end here. If buyers remain stronger, a bullish trend can be observed.
ETH price prediction: Funding flip signals bullish shift, but leverage is cooling.
Ethereum is trading near $2,288 on Binance Futures after climbing from roughly $2,235 over the past day and briefly tagging $2,315 on November 2. The more interesting story sits beneath the price.
Funding rates have swung from deeply negative, where shorts were paying longs, to positive at 0.0065%. That flip shows sentiment has shifted from bearish positioning to cautious optimism.
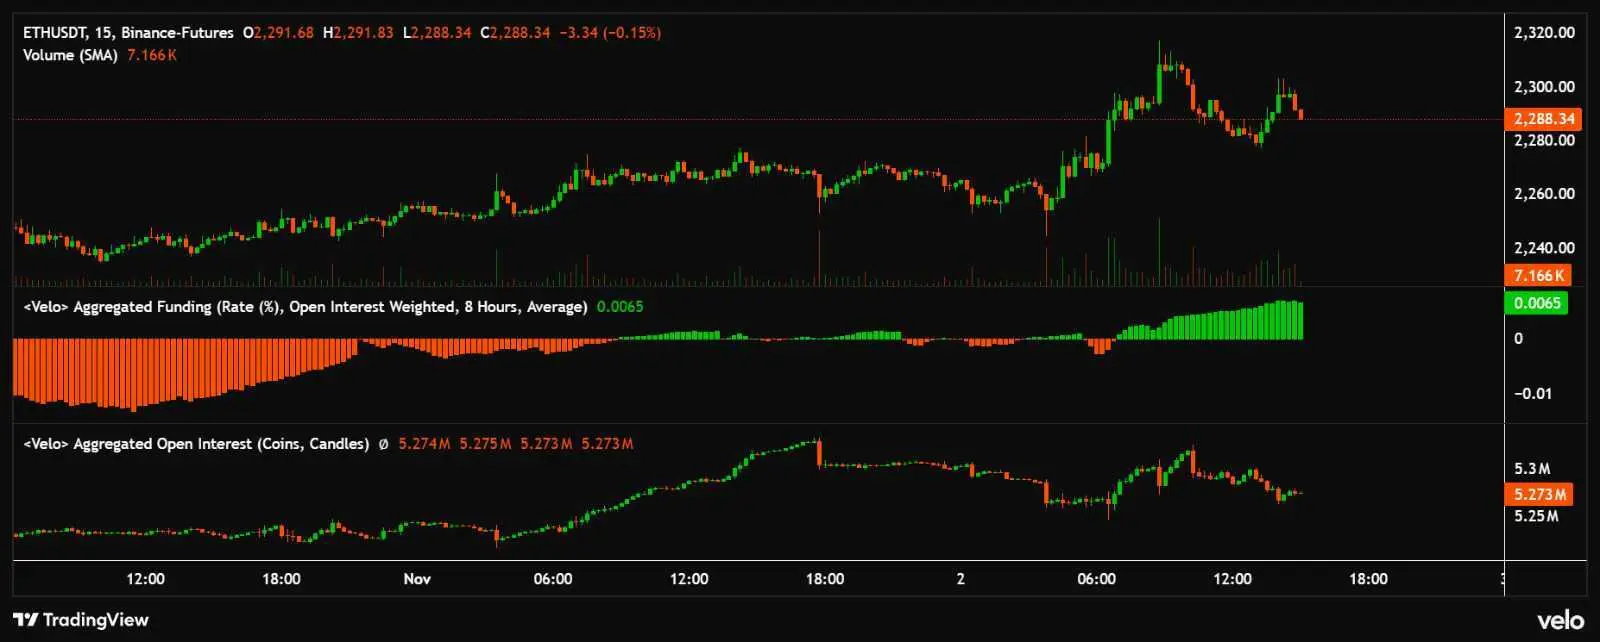 Source: ETH/USDT price, funding rate and OI data by CoinGlass
Open interest, however, tells a different story. After peaking near 5.32 million ETH coin, OI has slipped to 5.27 million, suggesting traders are closing positions rather than aggressively adding new longs.
Rising funding with falling OI hints that this rally may lack strong conviction. A hold above $2,280 keeps the path open toward $2,315 and higher. A break below $2,260 could trigger a pullback toward $2,240.
Ethereum price outlook: What October’s data tells us
Ethereum has had a rough month. After opening October near $2,650-$2,700, ETH slid sharply around October 7–9 and spent most of the month consolidating between $2,350 and $2,500. Another drop around October 29–30 pushed the price down to roughly $2,200, where it now sits with a slight recovery toward $2,270.
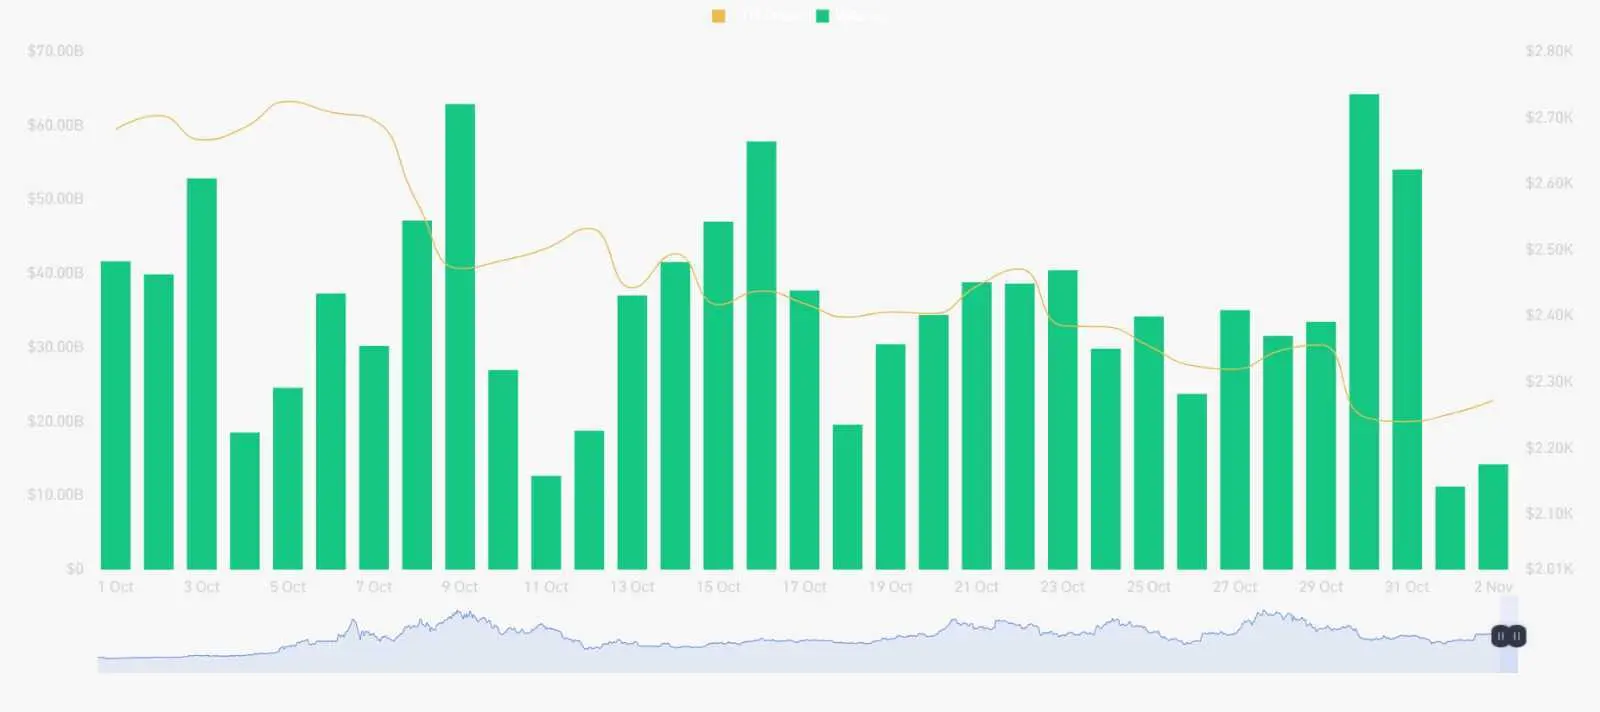
Source: ETH/USDT price and volume data by CoinGlass
Volume tells an interesting story. The biggest spikes, around $63B on October 9 and $64B on October 30, coincided with the sharpest price declines, which signals heavy selling pressure and capitulation. Since then, volume has dried up to just $11–14B on November 1–2, suggesting sellers are exhausted.
Prediction: If ETH holds the $2,200 support, a relief bounce toward $2,400-$2,500 is plausible in the coming weeks. A break below $2,200 could open a retest of $2,100. Low volume means traders are waiting for a catalyst, so watch for a volume surge to confirm the next move.
Final thought
Ethereum is attempting a recovery, but a confirmed reversal has not yet arrived. The broader trend since July remains bullish, yet October’s 22% drop from the late-September high left ETH near $2,288, still below key resistance at $2,360. Signals are mixed. Funding rates have flipped from negative to positive at 0.0065%, suggesting shorts are losing control, and volume has fallen sharply from the capitulation spikes of October 9 and 30, hinting that selling pressure is fading.
However, open interest is slipping from 5.32 million to 5.27 million ETH, which suggests the bounce is driven by short covering rather than fresh long conviction, and thin volume shows buyers are not yet committed. The most likely path is sideways consolidation between $2,200 and $2,360 until a catalyst appears. A daily close above $2,360 on rising volume would open the way toward $2,450-$2,500, while a break below $2,200 could trigger a retest of $2,100.
Why is the Ethereum price rising today?
ETH is up modestly, trading near $2,288 after a bounce from about $2,235. Funding rates have flipped from negative to positive (0.0065%), showing that bearish positioning is easing and short sellers are losing control.
Is the Ethereum correction over?
Not yet confirmed. A daily candle close above $2,360 would be the first real sign that the correction has ended. Until then, ETH remains in a recovery attempt after its 22% drop from the late-September high.
What are the key support and resistance levels for ETH?
Support sits at $2,280, $2,260 and $2,240, with $2,200 as the major level. Resistance is at $2,315 and $2,360, followed by $2,400-$2,500 if buyers take control.