

Few assets have given investors a rougher ride this year than gold. The gold price set an all-time record in late January, then fell for four straight months in a way that defied almost every textbook, bottoming below $4,000 an ounce in late June before turning sharply higher through July and August.
If you bought at the peak, you are still underwater. If you bought at the June low, you are sitting on a double-digit gain in under seven weeks. This article walks through the gold price month by month, explains what actually drove each move, and translates it all into what it has meant for buyers in India.
Gold price today: where things stand
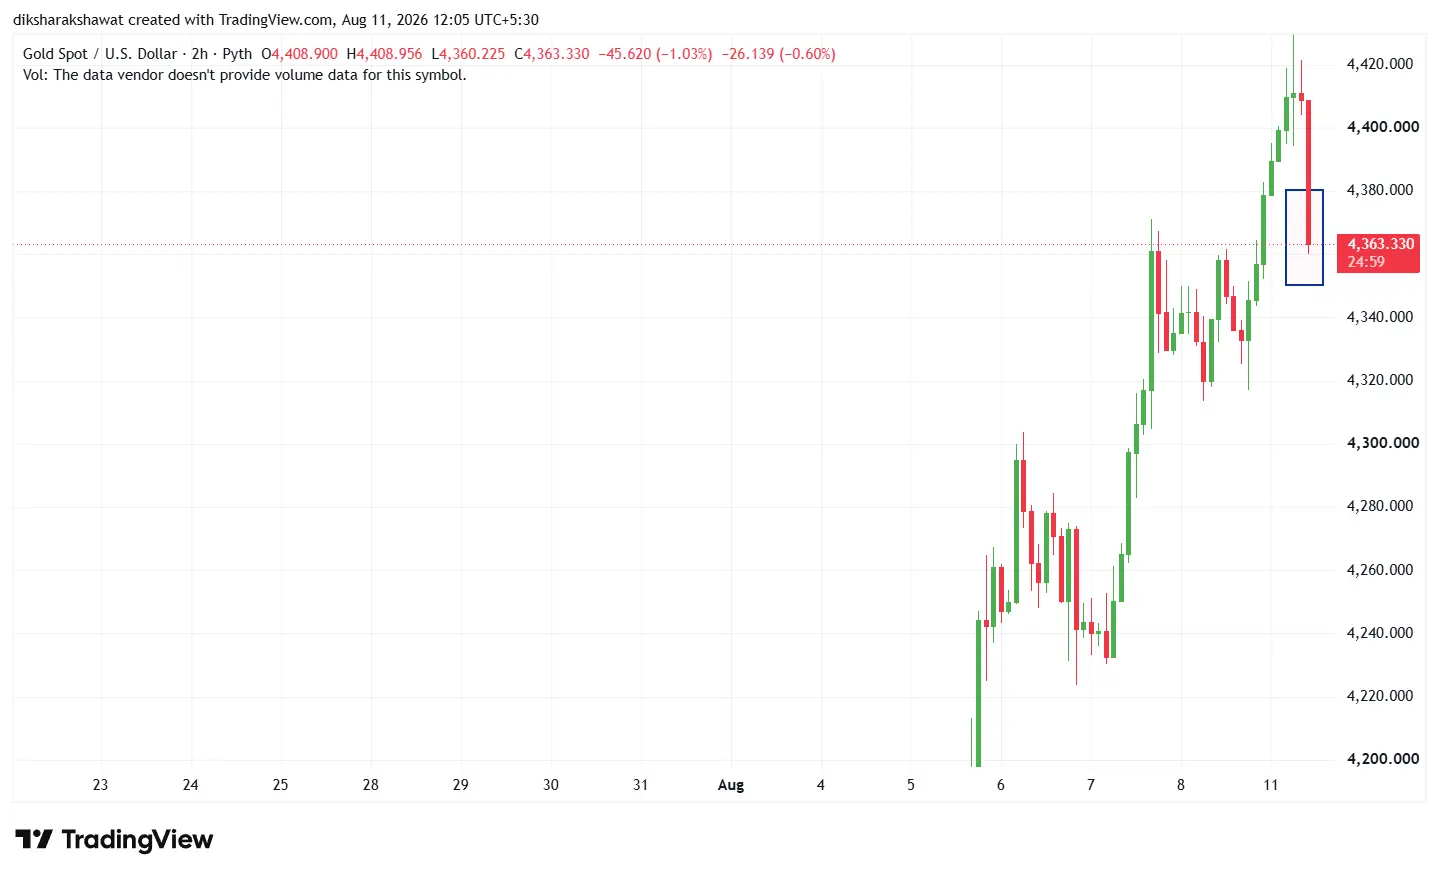
As of 11 August 2026, spot gold is trading in the $4,350 to $4,380 range. Gold rose to $4,378.76 an ounce on 10 August, up 0.81% on the day, with the metal up 9.42% over the past month and 30.98% higher than the same time last year.
In India, the picture looks like this:
|
Purity |
Rate per gram | Rate per 10 grams |
| 24 karat (99.9%) | ₹15,197 |
₹1,51,970 |
|
22 karat (91.6%) |
₹13,930 | ₹1,39,300 |
| 18 karat (75%) | ₹11,398 |
₹1,13,980 |
MCX gold is holding above ₹1.50 lakh per 10 grams, with silver near ₹2.45 lakh per kilogram. Rates vary by a few hundred rupees between cities, and these figures exclude GST, TCS, and making charges.
Despite the recovery, the gold price remains roughly 22% below January’s record. Here is how it got here.
January 2026: the gold price record that started the year
Gold entered 2026 with enormous momentum, extending a 2025 that had delivered gains of roughly 60% its best annual performance since 1979. The rally did not pause at the turn of the year. It accelerated.
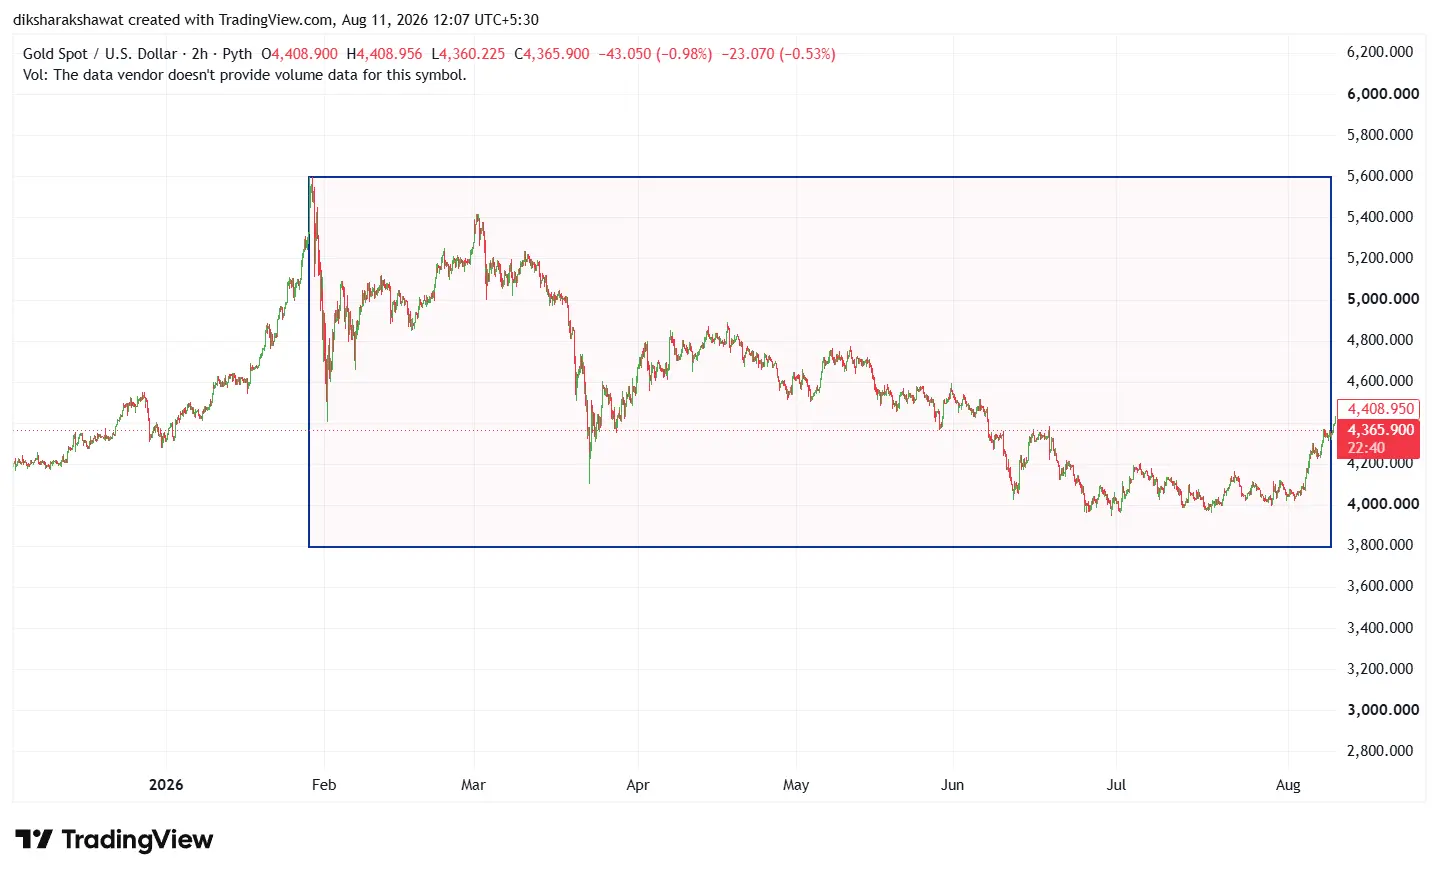
On 29 January, spot gold hit an all-time high of $5,595 an ounce, having crossed $5,500 intraday. The World Gold Council later described it as one of the most dramatic starts to any year on record.
The drivers were structural rather than speculative: sustained central bank accumulation, reserve diversification away from the dollar, and mounting concern about sovereign debt levels. US federal debt exceeded $37 trillion, generating over $1 trillion in annual interest. Central banks had been net gold buyers for four consecutive years.
Nobody watching the market in January was positioned for what came next.
February 2026: war arrives, and gold behaves exactly as expected
On 27 February, military conflict between the US and Iran escalated sharply. Gold did precisely what safe-haven theory predicts.
In the first 48 hours of the conflict, gold rose 5.2% while Bitcoin fell 6%, with Bitcoin trading in lockstep with the Nasdaq and S&P 500 rather than as a haven asset. For anyone arguing that gold remains the world’s crisis hedge, February 2026 is the cleanest evidence available.
February would also prove to be gold’s last positive month for a long stretch. When July eventually delivered a gain, it was described as the first monthly increase since February, which dates the turning point precisely.
March 2026: the worst month for the gold price since 2013
Here is where the year became genuinely counterintuitive. Gold shed more than 10% in March alone, its worst monthly decline since June 2013 during an active Middle East war.
The mechanism matters, and it is the single most useful thing for any gold investor to understand:
- The Iran conflict pushed oil prices sharply higher
- Higher oil-superccharged inflation expectations across the curve
- Markets responded by pricing out Federal Reserve rate cuts entirely
- Traders began assigning roughly 50% probability to at least one rate hike by year-end
- Higher-for-longer real yields strengthened the US dollar
Gold pays no interest. When real yields rise, holding a zero-yield asset becomes expensive, and when the dollar strengthens, dollar-denominated gold becomes costlier for every non-dollar buyer. The war created both headwinds simultaneously.
The lesson: geopolitical risk lifts the gold price only when it does not also trigger inflation and monetary tightening. In March 2026, it did.
April 2026: inflation refuses to cooperate
April offered no relief. Both CPI and PPI for the month printed above the Federal Reserve’s 2% annual target, and core inflation measures excluding food and energy remained substantially elevated. Core CPI came in at 0.4% month-on-month.
Core readings matter most to the Fed precisely because they strip out the commodity volatility that the oil spike was creating. As long as the core stayed hot, the tightening narrative held, and bullion stayed under pressure.
Notably, equity markets sat near record highs through this period despite the unresolved Iran situation. Risk appetite was intact. Gold was the asset being sold to fund it.
May 2026: cooling inflation, falling gold price
May produced the year’s strangest divergence. Inflation actually started improving core CPI decelerated to 0.2% month-on-month from 0.4% in April, bringing the annual core rate to 2.9%. Yet gold kept sliding.
The explanation lies in opportunity cost rather than inflation. Dollar strength during rate-repricing periods signals capital rotating into dollar-yielding assets, which competes directly with gold’s role as a capital-preservation vehicle. Gold was not losing the inflation argument. It was losing the yield argument.
Technical levels held up better than sentiment suggested. The 300-day moving average sat at $3,980 an ounce and was still rising, while one widely watched dollar-debasement fair value model put gold at $4,017.
June 2026: the gold price bottoms below $4,000
June was the most eventful month of the year, and it broke in three stages.
- 5 June: the jobs shock. May non-farm payrolls came in at twice the consensus, with April revised higher. Gold erased the last of its 2026 gains. Silver sank below $69.50, its lowest since late March, and US and German 10-year yields hit two-week highs above 4.50% and 3.00% respectively.
- 10 June: the technical break. Gold traded at $4,165, down 25% from the January high, and closed below its 200-day moving average for the first time since October 2023. The gold-to-silver ratio had climbed to roughly 63.9 from 55.16 in May.
- 16–17 June: a new Fed chair. Kevin Warsh chaired his first FOMC meeting, a known price-stability hawk taking the seat during an active inflation scare.
- 24 June: the low. Spot briefly broke under $4,000, printing a 2026 low of $3,974.51. Measured from the January peak, that was a decline of roughly 29%.
The half-year scorecard was brutal by gold’s standards: down roughly 7% year-to-date as of 26 June, with a Q2 drawdown of about 16%, the worst quarter in 13 years. Global gold demand in Q2 fell to 942 tonnes, the lowest since Q3 2021.
For context, gold’s 7% first-half loss still looked mild against Bitcoin, which fell 33% over the same period.
July 2026: the first monthly gain since February
July started badly. Gold broke decisively below the key $4,300 support level in early July following renewed US strikes on Iran and rising odds of a September Fed hike. Forecasts were slashed across the street.
Then it stabilised near $4,050 and ground higher, finishing the month up roughly 0.5%, its first monthly increase since February. Support came from softer US inflation data and the Fed’s decision to hold rates.
The 29 July FOMC meeting is worth dwelling on. Rates were held, but three FOMC members dissented in favor of a hike. Chair Warsh reaffirmed his commitment to reducing inflation while giving no indication that borrowing costs would rise imminently. A hold with three hawkish dissents is an unusual signal it tells you how genuinely split the committee had become.
Analyst forecasts capitulated during the month:
|
Institution |
July revision |
| HSBC |
Cut 2026 target from $4,900 to $4,560 |
|
J.P. Morgan |
Cut to $4,500 for Q4 2026 |
| StoneX |
Cut to $4,000 by year-end |
|
UBS |
Raised targets on 23 July, the lone upgrade |
August 2026: the jobs report that flipped the gold price
The turn came on Friday, 7 August, and it came from the US labor market.
The economy unexpectedly lost 23,000 jobs in July, following a downwardly revised 20,000 increase in June and falling far short of forecasts for an 80,000 gain. That single release dismantled the case for further Fed tightening. Markets moved to price around a 44% chance of a 25 basis point hike in September, down from 67% a week earlier.
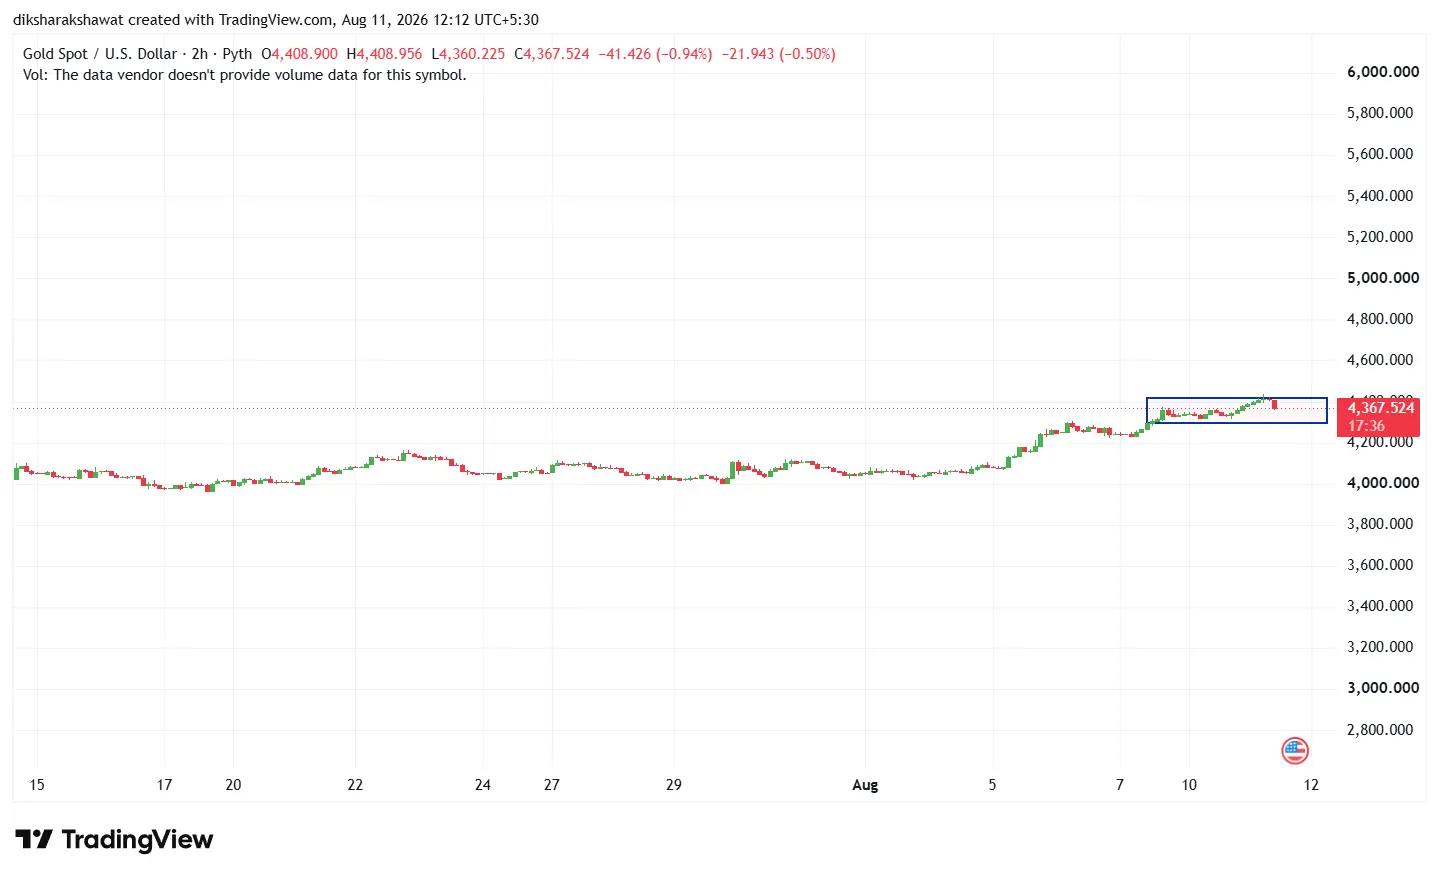
Gold surged more than 7% over the week, its strongest weekly performance in years, and has held above $4,300 since. It has done so even as oil climbed higher, with WTI up nearly 6% to $81.54 a barrel amid stalled efforts to reopen the Strait of Hormuz.
Technically, gold now holds above its 50-day simple moving average near $4,150 while sitting below the 100-day around $4,389. That gap defines the current battleground.
Two data releases this week will likely decide the next move: July CPI on 12 August and PPI on 13 August.
Gold price in India: why ₹1.52 lakh doesn’t simply track spot
Indian buyers rarely see the international gold price reflected exactly in their local rate, and the gap has several components.
The domestic rate is built from the London spot benchmark, converted at the prevailing USD/INR rate, then adjusted for import duty, 3% GST, and the margin set by each city’s jewellers’ association. Local transport costs and dealer overheads add the final variation, which is why Chennai, Mumbai and Delhi rates differ by a few hundred rupees on any given day.
The rupee has been the quiet story of 2026. Because USD/INR weakened over the year, the rupee rate fell considerably less than the dollar gold price during the March-to-June drawdown. An Indian investor’s experience of this year has been meaningfully gentler than the headline 29% peak-to-trough decline suggests. It is worth charting both lines side by side.
What actually drives the gold price?
Strip away the noise, and four forces explain most of what happened above.
- Real interest rates: The single biggest driver. Gold yields nothing, so when inflation-adjusted yields rise, gold becomes relatively less attractive. This drove the entire March-to-June decline.
- The US dollar: Gold is priced in dollars, so a stronger dollar mechanically pressures the gold price and weakens demand from every non-dollar buyer.
- Central bank demand: The structural floor under this market. Sovereign buyers have been net accumulators for four consecutive years and do not sell on short-term sentiment shifts.
- Geopolitics: The least reliable of the four, as 2026 demonstrated. Conflict lifts gold when it drives fear but suppresses it when it drives inflation and tightening.
Gold price outlook for the rest of 2026
Forecasts remain unusually wide. The published bank spread runs from roughly $4,300 to $6,300 an ounce, with Deutsche Bank and J.P. Morgan at the lower end and Wells Fargo and Bank of America at the top. The World Gold Council’s mid-year outlook points to a rangebound second half of $4,100 to $5,000.
The base case assumes central bank buying continues at its recent pace, ETF flows stay broadly net-positive, and the Fed holds or cuts only modestly. Under those conditions, gold spends the rest of the year in that band.
The signposts to watch are simple. A sustained break above $5,000 argues for the upper half of the range. A decisive drop under $3,900 would put the entire bull thesis on trial. In the near term, a daily close back above the $4,300 to $4,320 zone that broke in early July is the technical trigger bulls want.
What does this mean for Indian buyers?
If you hold crypto, 2026 has already made the argument for you. Over the first half, gold fell around 7%, while Bitcoin fell 33%. In the first 48 hours of the February conflict, gold rose 5.2% while Bitcoin dropped 12%, trading in lockstep with equities rather than as a haven. The two assets are not interchangeable, and this year proved it.
The practical question is how to hold gold without leaving the crypto environment. That is what tokenized gold solves.
PAXG and XAUT: gold you can hold on-chain
Two tokens dominate this category, and both are backed by allocated physical metal rather than a price feed.
- PAXG (Paxos Gold) is an ERC-20 token where each unit represents one fine troy ounce of a London Good Delivery bar held in professional vaults. Paxos is regulated by the New York Department of Financial Services, publishes regular attestations, and allows qualifying holders to redeem tokens for physical bullion.
- XAUT (Tether Gold) works on the same principle, with each token representing one troy ounce held in a Swiss vault. It is issued on both Ethereum and TRON, which gives holders a choice between security and lower transfer costs.
Why does a tokenized gold SIP make sense after a year like this?
SunCrypto supports Crypto SIP on both PAXG and XAUT, alongside BTC, ETH and a range of other tokens, with installments starting from ₹100 and zero fees on the plan.
The case for systematic buying over a lump sum is not theoretical this year; it is arithmetic. Anyone who bought gold at January’s $5,595 peak is still roughly 22% underwater. Anyone who kept buying monthly through the March-to-June decline accumulated at an average cost far below that, and picked up their largest quantity of metal at exactly the moment sentiment was worst, near the $3,974 June low.
That is the entire logic of rupee-cost averaging applied to an asset that just delivered a 29% drawdown inside five months. Set a fixed monthly amount, pick a date shortly after payday, and stop trying to call the bottom.
Trading gold on SunCrypto Futures
For traders rather than accumulators, SunCrypto offers INR-margined futures on PAXG and XAUT, alongside tokenized metals contracts covering gold, silver, platinum, and palladium. Positions can be margined in INR or USDT, and the contracts trade two-way, so you can take a short position when the setup calls for it.
This matters because 2026 has been a two-way market. A trader who correctly read the March inflation dynamic could have shorted gold into a 10% monthly decline, an outcome unavailable to anyone holding only physical metal or a spot position.
Futures also allow hedging. If you hold a growing PAXG SIP position and expect near-term weakness, a small short can offset some of the drawdown without selling your accumulated stack and triggering a taxable event.
The tax reality you need to plan for
This is where Indian holders need to be clear-eyed. PAXG and XAUT are treated as Virtual digital assets are under Indian tax law, which means gains are taxed at a flat 30% regardless of holding period, with 1% TDS on transfers and no ability to offset losses against other income.
A gold ETF or gold mutual fund is taxed under capital gains rules instead, which is a materially more favorable treatment for a long-term holder. Tokenized gold wins on accessibility, 24/7 liquidity, fractional size, and on-chain verifiability. It does not win on tax.
The sensible conclusion for most people is not one or the other. Tokenized gold suits traders who want metal exposure inside the crypto environment, want to trade it two-way, or want to accumulate in small fixed amounts. A conventional gold fund may suit a pure buy-and-hold allocation better. Knowing which job you are hiring the asset for is the whole decision.
Conclusion
Gold’s 2026 has been a masterclass in why simple narratives fail. War did not lift gold; it crushed it by way of oil and inflation and the Fed. Cooling inflation did not save gold in May, because the dollar was doing the damage. And it took a weak jobs report, not a geopolitical event, to finally turn the market higher in August.
For Indian investors, the practical takeaway is that the gold price is driven overwhelmingly by US monetary policy, filtered through the rupee. Watch real yields and the Fed, not headlines about conflict. And size positions for the reality that this asset delivered a 29% drawdown inside five months this year, in the middle of what most people still call a bull market.
What is the gold price today in India?
24 karat gold is around ₹15,197 per gram, or ₹1,51,970 per 10 grams. 22 karat sits near ₹13,930 per gram, and 18 karat near ₹11,398. MCX gold is holding above ₹1.50 lakh per 10 grams. Rates update daily and exclude GST, TCS, and making charges.
What was gold’s highest price in 2026?
Roughly $5,595 an ounce on 29 January. Quoted records range from $5,589 to $5,602 depending on whether the source uses intraday spot or a benchmark fix worth checking which figure your source means.
How far has gold fallen from its 2026 peak?
It’s currently about 22% below the January record. At the June low of $3,974, the decline was roughly 29%.
Why did gold fall in 2026 despite an active war?
Because the conflict raised oil prices, which raised inflation expectations, which caused markets to price in Fed rate hikes rather than cuts. Higher real yields and a stronger dollar are gold’s two biggest headwinds, and the war produced both at once. Geopolitical risk lifts gold only when it doesn’t simultaneously trigger monetary tightening.
Why is gold rising again?
The US economy unexpectedly lost 23,000 jobs in July, against forecasts for an 80,000 gain. That collapsed the case for further Fed tightening odds of a September rate hike fell from roughly 67% to 44% in a week and gold gained more than 7% over the following week.
What is the outlook for the rest of 2026?
Forecasts are unusually wide. The published bank spread runs from about $4,300 to $6,300 an ounce, while the World Gold Council’s mid-year outlook points to a rangebound $4,100 to $5,000 second half. A sustained break above $5,000 argues for the upper half; a decisive drop under $3,900 would challenge the bull case.
Why does the gold rate differ between Indian cities?
The domestic rate builds from the London spot benchmark, converted at USD/INR, then adjusted for import duty, 3% GST, and each city’s jewellers’ association margin. Local transport costs and dealer overheads create the final few hundred rupees’ spread between Delhi, Mumbai, and Chennai.
Does a weaker rupee push Indian gold rates higher?
Yes. Because gold is priced in dollars, rupee depreciation raises the local rate independently of what international gold does. This is why Indian investors experienced a materially shallower drawdown than the 29% dollar decline in 2026.
What’s the difference between 24K and 22K gold?
24 karat is 99.9% pure and used mainly for coins, bars, and investment. 22 karat is 91.6% pure, alloyed with other metals for hardness, and is what most Indian jewelry is made from. The purity difference is why 22K trades at roughly 92% of the 24K rate.
Is gold or Bitcoin the better safe haven?
2026 offered a clean test. In the first 48 hours of the February conflict, gold rose 5.2% while Bitcoin fell 12%, trading in lockstep with equities. Over the first half, gold fell around 7% against Bitcoin’s 33%. The evidence suggests they serve different portfolio functions rather than being interchangeable hedges.
Should I buy gold as a lump sum or through a SIP?
2026 is a strong argument for staggered entry. Anyone who invested a lump sum in January is still underwater; anyone buying monthly through the drawdown has a considerably better average cost. Rupee-cost averaging suits an asset this volatile.
How much gold should be in a portfolio?
A 5% to 15% allocation is the conventional range. This year is a useful reminder that gold can draw down 29% in five months; it’s a diversifier, not a guarantee.