

Candlestick patterns are something that comes before the indicators and complicated strategies. Every candle on a chart tells us about the fight between buyers and sellers, and learning to read charts is one of the fastest ways to understand what the market is doing. Whether you trade stocks, forex, or crypto, a handful of patterns show up again and again and here are the ones worth knowing.
What are candlestick patterns?
Candlestick patterns show what happened to the price during one fixed period of time. That period can be one minute, one hour, one day, or any other timeframe you choose on your chart. Each candle records four prices: the open (where the price started), the close (where it ended), the high (the highest price reached), and the low (the lowest price reached).
The wide part of the candle is called the body. It stretches from the open price to the close price. The thin lines above and below the body are called wicks or shadows, and they show how far the price travelled before it came back. A green candle, also called bullish, means the price closed higher than it opened, so buyers won the period. A red candle, also called bearish, means the price closed lower than it opened, so sellers won.
Here is the simplest way to read a candlestick patterns. A big body means one side was strongly in control. A small body means neither side could take charge. A long wick means the price went somewhere and was pushed back, which tells you that the move was rejected. Nearly every pattern in this guide is just a combination of big bodies, small bodies, and long wicks. If you understand these three ideas, you already understand most of candlestick patterns trading.
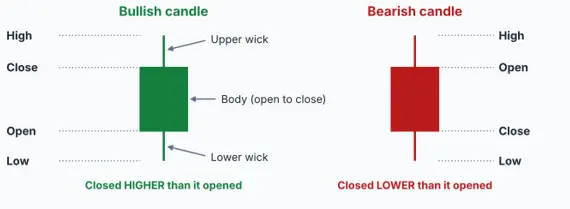
Diagram: the parts of a candlestick.
Three rules to follow before you trade any candlestick patterns
Rule 1: Check the trend first. A candlestick patterns means different things in different places. A hammer shape after a long fall can signal a bounce, but the same shape in the middle of a rise is mostly meaningless. Before you look at any pattern, ask yourself whether the price has been rising, falling, or moving sideways. Reversal patterns need a trend to reverse.
Rule 2: Wait for confirmation. A single candle is a clue, not a promise. Many traders wait for the next candle to move in the expected direction before they act. You may enter a little later, but you avoid many false signals.
Rule 3: Look at the location and the volume. A pattern is much stronger when it forms at a level where price has turned before, such as a clear support or resistance zone, and when trading volume is higher than usual. The same shape in empty space with low volume deserves far less trust.
How to read the diagrams in this guide
Every diagram follows the same layout so you can compare candlestick patterns easily. The faded candles on the left show the trend before the pattern. The yellow dashed box marks the pattern itself. In patterns with more than one candle, numbers mark each candle in the order it appears, and the notes on the right explain what each candle is doing. At the bottom of each diagram you will see where the pattern usually appears and which way price is hinted to move next.
Single-candlestick patterns
Single-candle patterns give you the fastest read on the mood of the market, because you only need one candle to spot them. The catch is that one candle can be misleading, so these patterns work best when you also follow the three rules above.
- Doji
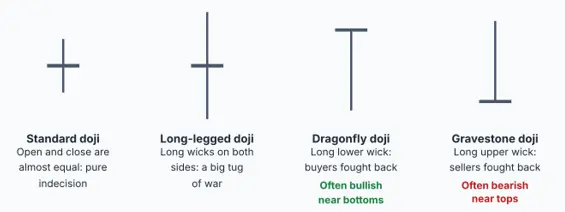
Diagram: the doji and its three common variations.
What it looks like: A doji is a candle whose open and close are almost the same, so it has no real body, only a thin line. It looks like a cross or a plus sign. The wicks can be short or long, and traders name a few special types. The long-legged doji has long wicks on both sides, the dragonfly doji has a long lower wick and no upper wick, and the gravestone doji has a long upper wick and no lower wick.
What it is telling you: Think of a tug of war where both teams pull equally hard and the rope does not move. Buyers pushed the price up, sellers pushed it down, and by the end of the period the price came back to where it started. A doji means indecision. After a long rise or fall, that sudden hesitation can warn you that the trend is running out of energy.
How to use it: A doji on its own does not tell you which way price will go, so look at where it appears. A dragonfly doji near a support level can hint at a bounce, while a gravestone doji near a resistance level can hint at a drop. Wait for the next candle to show you which side wins before you act.
- Spinning top
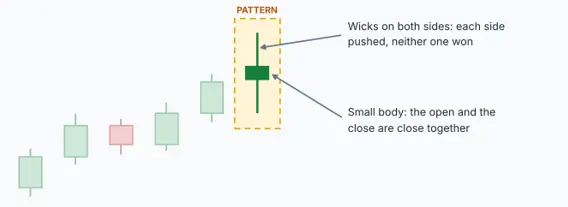
Diagram: a spinning top has a small body and wicks on both sides.
What it looks like: A spinning top has a small body in the middle with wicks of about the same length above and below it. It can be green or red, because the colour matters much less than the shape.
What it is telling you: Like the doji, the spinning top shows indecision, with one small difference. A doji closes almost exactly where it opened, while a spinning top has a small body, which means one side edged slightly ahead. During the period both buyers and sellers pushed hard, yet neither managed to take control. This often happens when a trend is getting tired.
How to use it: One spinning top is not a trading signal by itself. It becomes interesting when you see several of them in a row after a strong move, because that suggests the market has lost its direction. Treat it as a reason to slow down, tighten your stop-loss, and watch the next candles carefully.
- Hammer
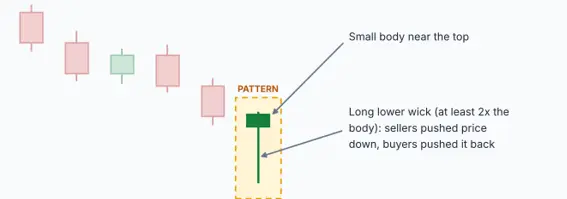
Diagram: a hammer after a downtrend, with a small body and a long lower wick.
What it looks like: A hammer has a small body at the top and a long lower wick that is at least twice as long as the body. It has little or no upper wick, so the whole shape looks like a hammer or a T. The body can be green or red, although a green body is slightly more bullish.
What it is telling you: Here is the story behind the shape. During the period sellers took control and pushed the price far down. Then buyers stepped in, fought back, and pushed the price almost all the way back up before the candle closed. The long lower wick shows that low prices were rejected. When this happens after a fall, it suggests that sellers are running out of strength and buyers are getting ready to take over.
How to use it: A hammer only counts when it appears after a downtrend, ideally near a support level. Many traders wait for the next candle to close higher than the hammer before buying, and place a stop-loss just below the hammer’s low. If price falls below that low, the signal has failed and it is time to step aside.
- Hanging man
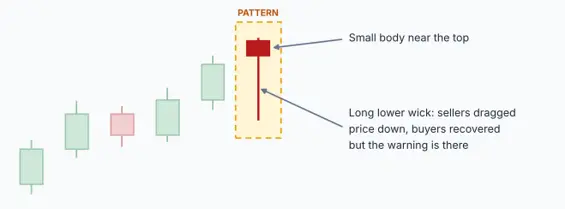
Diagram: the same shape as a hammer, but after an uptrend.
What it looks like: The hanging man candlestick patterns looks exactly like the hammer: a small body at the top and a long lower wick. The only difference is where it appears. A hanging man shows up after a rise, not after a fall.
What it is telling you: Buyers were in control for the whole rally, but during this period sellers pushed the price sharply lower. Buyers recovered most of the drop by the close, so the candle does not look scary, yet the deep dip shows that sellers are now strong enough to attack. It is like seeing a crack in a wall. The wall is still standing, but you start to wonder how long it will last.
How to use it: The hanging man is a warning, not an order to sell. It is more reliable when it appears near a resistance level or after a long rally, and when the next candle closes lower. If the next candle is a strong green one, the warning has failed and the uptrend may simply continue.
- Inverted hammer
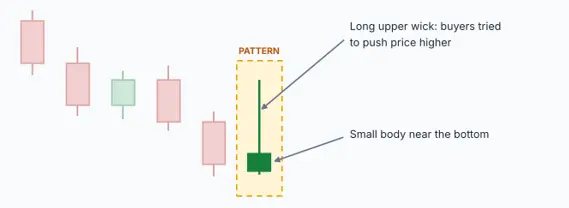
Diagram: an inverted hammer after a downtrend, with a long upper wick.
What it looks like: An inverted hammer is an upside-down hammer. It has a small body at the bottom and a long upper wick, with little or no lower wick. It appears after a downtrend.
What it is telling you: During this period buyers tried to push the price up strongly, but sellers pushed it back down before the close. That may sound bearish, but after a long fall it is actually a hopeful sign, because for the first time in a while buyers had enough strength to try. It is an early hint that selling pressure may be fading.
How to use it: This is one of the weaker signals, so confirmation matters a lot. Wait for the next candle to close above the inverted hammer’s high, ideally as a strong green candle, before you think about buying. Without that follow-through, it is just a candle with a long wick.
- Shooting star
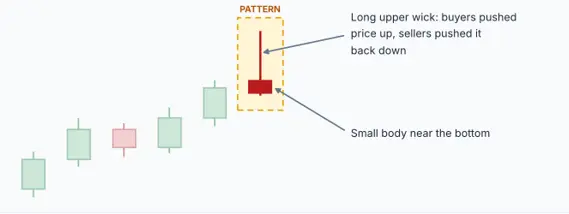
Diagram: a shooting star after an uptrend, with a long upper wick.
What it looks like: A shooting star has a small body at the bottom and a long upper wick that is at least twice the size of the body, with little or no lower wick. It has the same shape as the inverted hammer, but it appears after a rise.
What it is telling you: Buyers pushed the price sharply higher during the period, which looked exciting. But sellers jumped in, pushed the price all the way back down, and the candle closed near where it started. The long upper wick is a sign that high prices were rejected. After a rally, it often means buyers have run out of steam.
How to use it: It is strongest near a resistance level, after a long advance, or when volume is high. Most traders wait for the next candle to close below the shooting star’s low before selling or leaving a long trade. A stop-loss just above the shooting star’s high keeps your risk small if the signal fails.
- Marubozu
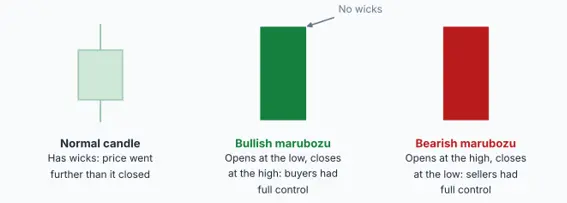
Diagram: a normal candle compared with a bullish and a bearish marubozu.
What it looks like: A marubozu is a candle with a long, solid body and little or no wicks. A green marubozu opens at its lowest price and closes at its highest. A red marubozu opens at its highest price and closes at its lowest. The name comes from Japanese and is often described as meaning bald or shaved, which fits the missing wicks.
What it is telling you: With no wicks, there was no real fight. Buyers (or sellers) were in complete control from the first moment to the last. It is the clearest picture of strength you can see on a chart. A green marubozu says buyers dominated the period, and a red one says sellers did.
How to use it: A marubozu is not a reversal pattern. It usually shows that the current move has real power behind it. Traders often look for one at the start of a breakout, or as a sign that an existing trend is continuing. Be careful with very large marubozus after an already long move, because the market may need a pause before it can go further.
Two-candlestick patterns
Two-candlestick patterns compare one candle with the one before it. The first candle shows what the market was doing, and the second candle shows how the market reacted. Because they use two periods of evidence instead of one, they are usually more reliable than single-candle patterns.
- Bullish engulfing
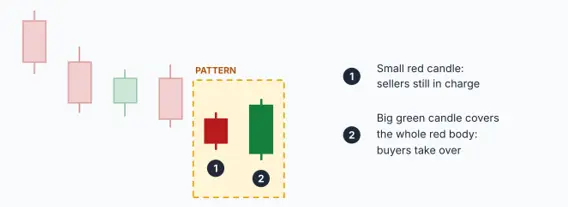
Diagram: a big green candle completely covers the small red candle before it.
What it looks like: A bullish engulfing candlestick patterns has two candles. The first is a small red candle. The second is a larger green candle whose body completely covers, or engulfs, the body of the red candle. It appears after a downtrend.
What it is telling you: In the first candle sellers were still pushing the price down, but without much force. Then the next candle opens at or below that close, and instead of continuing the fall, buyers surge in and push the price above the previous candle’s open. That is a sudden and complete change of control. It is as if the buyers walked into a room, took over, and left no doubt about who is in charge.
How to use it: This is one of the most popular reversal signals. It is strongest near a support level and when the green candle comes with higher volume than usual. A common approach is to enter after the green candle closes and place a stop-loss below its low. The bigger the green candle is compared with the red one, the stronger the message.
- Bearish engulfing
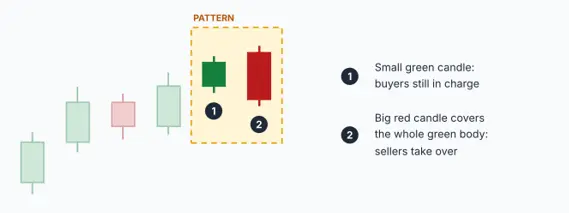
Diagram: a big red candle completely covers the small green candle before it.
What it looks like: The bearish engulfing candlestick patterns is the mirror image of the bullish one. A small green candle is followed by a larger red candle whose body completely covers the green one. It appears after an uptrend.
What it is telling you: Buyers were comfortably in control, and then sellers hit the market with so much force that they erased the previous candle’s gains and more. It signals that control has shifted from buyers to sellers, and it often shows up near the top of a rally.
How to use it: It works best near a resistance level after a strong rise, and when the red candle has high volume. Traders often use it as a signal to close long positions, tighten a stop-loss, or look for short trades. If you do short, a stop-loss above the high of the red candle keeps the risk clear.
- Bullish harami
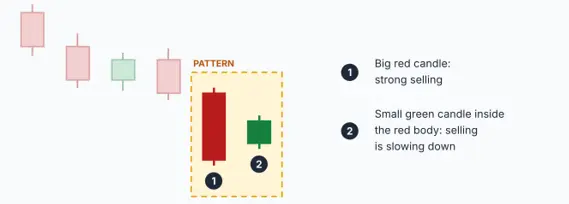
Diagram: a small green candle sits inside the body of a big red candle.
What it looks like: In a bullish harami candlestick patterns, a large red candle is followed by a small green candle that sits completely inside the body of the red one. The word harami is often translated as pregnant, which describes the picture well: a big candle with a small one inside it. It appears after a downtrend.
What it is telling you: The big red candle shows strong selling. The next candle is small and goes nowhere, which shows that selling has suddenly slowed down. This is the opposite of an engulfing pattern. An engulfing pattern says the other side has taken over, while a harami only says the current side is getting tired.
How to use it: Because the signal is gentle, treat it as a heads-up rather than a trigger. It becomes much more useful when the next candle moves higher and the pattern sits near support. Do not buy on the harami alone.
- Bearish harami
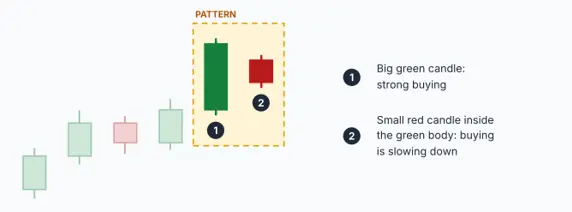
Diagram: a small red candle sits inside the body of a big green candle.
What it looks like: A bearish harami candlestick pattern is a large green candle followed by a small red candle that sits entirely inside its body. It shows up after a rise.
What it is telling you: Buyers had been strong, but the second candle shows that their strength is fading. The small red body means sellers have started to push back, although they have not yet won.
How to use it: As with the bullish harami, wait for confirmation. If the next candle closes lower, the case for a turn gets stronger. If price simply moves up again, the uptrend is still alive. Many traders use the bearish harami as a prompt to tighten their stop-loss rather than to open a new short trade.
- Piercing line
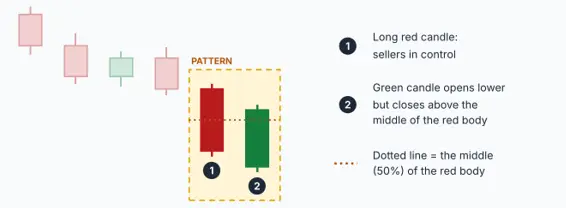
Diagram: the green candle closes above the middle of the red candle’s body.
What it looks like: The piercing line has two candles. The first is a long red candle. The second is a green candle that opens lower than the red candle’s close but then rallies and closes above the middle of the red candle’s body. It appears after a downtrend.
What it is telling you: The second candle starts by falling further, which looks like more bad news. But buyers step in aggressively and take back more than half of the previous candle’s fall. This shows that buyers are strong at lower prices. Think of it as a milder cousin of the bullish engulfing pattern: buyers did not fully cover the red candle, but they got more than halfway.
How to use it: The deeper the green candle closes into the red body, the stronger the signal. Look for it near support and wait for the next candle to confirm. If price then falls below the low of the green candle, the pattern has failed.
- Dark cloud cover
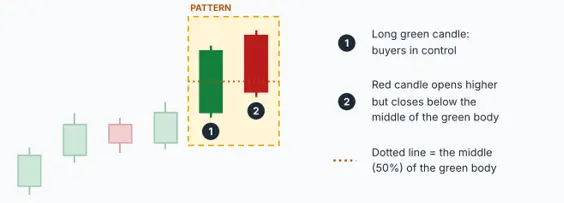
Diagram: the red candle closes below the middle of the green candle’s body.
What it looks like: Dark cloud cover candlestick patterns is the opposite of the piercing line. A long green candle is followed by a red candle that opens higher but closes below the middle of the green candle’s body. It appears after an uptrend.
What it is telling you: The market opens with good news and looks ready to go even higher, but sellers take over and drag the price down through more than half of the green candle. The mood has turned from excitement to doubt, like a dark cloud passing over a sunny day.
How to use it: It is more reliable when it appears near a resistance level or after a long rise. Wait for the next candle to confirm. If the price climbs above the red candle’s high, the signal has failed. Traders often use this pattern as a cue to book profit on long trades.
- Tweezer top
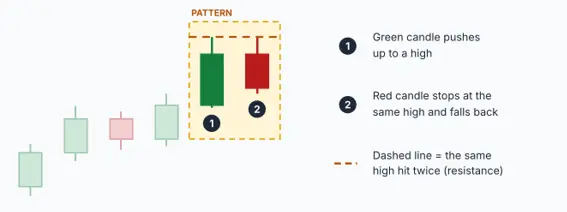
Diagram: two candles reach the same high and then price falls back.
What it looks like: A tweezer top candlestick patterns has two candles with the same, or almost the same, high. The first candle is usually green and the second is usually red. It appears after an uptrend. The name comes from the two highs lining up like the tips of a pair of tweezers.
What it is telling you: Buyers pushed the price up to a certain level on the first candle. On the second candle they tried again and failed at exactly the same level, and sellers pushed the price back down. When the market is rejected twice at the same price, that price becomes a ceiling, which traders call resistance.
How to use it: The pattern is strongest when the matching highs line up with a resistance zone you can already see on the chart. A red second candle that closes below the first candle’s body makes the signal stronger. A stop-loss just above the shared high keeps the trade simple.
- Tweezer bottom
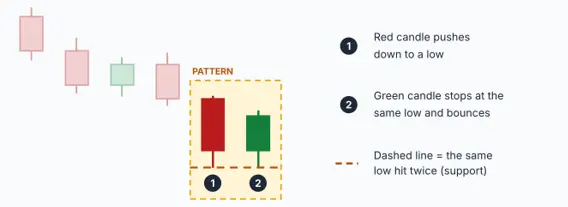
Diagram: two candles reach the same low and then price bounces.
What it looks like: A tweezer bottom candlestick patterns is the mirror image. Two candles share the same, or almost the same, low. The first is usually red and the second is usually green. It appears after a downtrend.
What it is telling you: Sellers pushed the price down to a level and could not push it any lower on the second try. Buyers defended that level twice. That price now acts like a floor, called support, and a bounce becomes more likely.
How to use it: It is strongest when the matching lows sit at a known support zone and the green candle comes with higher volume. Place a stop-loss just below the shared low. If price breaks below it, the floor has failed and the idea is over.
- Inside bar
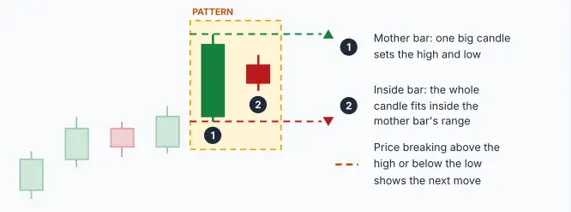
Diagram: a small candle stays inside the range of a big mother candle.
What it looks like: An inside bar candlestick patterns has two candles. The first is a large candle called the mother bar. The second is a smaller candle whose entire range, wicks included, stays inside the high and low of the mother bar. The colours of the candles matter less than their size and position.
What it is telling you: After a big move, the market takes a breath. The small candle shows that price is squeezing into a tight space, like a spring being pressed down. Neither side wants to commit. Sooner or later price breaks out of that range, and the direction of the breakout shows the next move.
How to use it: Traders mark the mother bar’s high and low. A close above the high suggests an upward move, while a close below the low suggests a downward one. The pattern works best on higher timeframes such as the daily chart, and when the mother bar is a strong candle in the direction of the trend. On very short timeframes it appears constantly and produces many false breakouts.
Three-candlestick patterns
Three-candlestick patterns tell a fuller story. Instead of one moment or one reaction, you see a beginning, a middle, and an end. That is why many traders trust them more than the smaller patterns, although none of them is perfect.
- Morning star
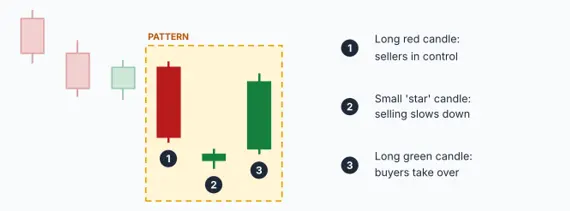
Diagram: a long red candle, a small star, and a long green candle.
What it looks like: The morning star candlestick patterns appears after a downtrend and has three candles. The first is a long red candle. The second is a small candle, called the star, that sits below the first candle and can be red, green, or a doji. The third is a long green candle that closes well into the body of the first red candle.
What it is telling you: The pattern tells a story in three acts. First, sellers are in full control. Then the small star shows that the selling has stopped and nobody is sure what comes next. Finally, a strong green candle shows that buyers have taken over. Just as the morning star shines shortly before sunrise, this pattern often appears before a new upward move begins.
How to use it: The closer the third candle closes to the top of the first candle, the stronger the signal. It is even more convincing when the star is a doji, when volume rises on the third candle, and when the pattern forms at a support level. A stop-loss below the lowest point of the star keeps the risk small. In crypto, where markets trade round the clock, the star rarely leaves a true gap, so look for the same idea even if the candles touch.
- Evening star
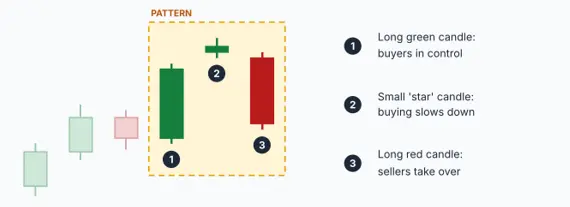
Diagram: a long green candle, a small star, and a long red candle.
What it looks like: The evening star is the mirror image of the morning star and appears after an uptrend. The first candle is a long green one. The second is a small star candle above it. The third is a long red candle that closes well into the body of the first.
What it is telling you: Buyers are in control, then they hesitate, and then sellers take over. Just as evening comes before night, this pattern often appears before the light goes out on a rally and a downtrend begins.
How to use it: It is stronger when the third candle closes deep into the first, when the star is a doji, when the pattern forms near resistance, and when the red candle comes with high volume. A stop-loss above the high of the star is a common choice. Many traders use it as a signal to book profit on long trades.
- Three white soldiers
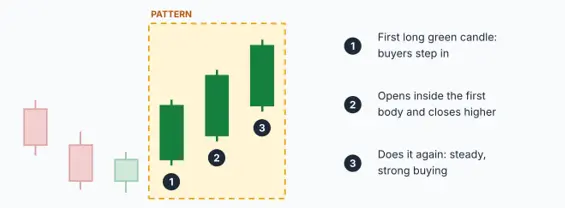
Diagram: three long green candles, each closing higher than the last.
What it looks like: Three white soldiers are three long green candles in a row. Each one opens inside the body of the previous candle and closes higher than the last, with small or no wicks. They usually appear after a downtrend or a quiet sideways phase.
What it is telling you: Like soldiers marching forward step by step, buyers win three periods in a row with very little resistance. Small upper wicks show that buyers held on to their gains until the close. It shows steady, determined buying and often marks the start of a new uptrend.
How to use it: It works best when the candles are similar in size, with small wicks, and volume is healthy. Be careful if the candles are huge or if the pattern appears after a long rally, because the move may be exhausted and a pullback can follow. Many traders enter on a small dip after the pattern instead of chasing the third candle.
- Three black crows
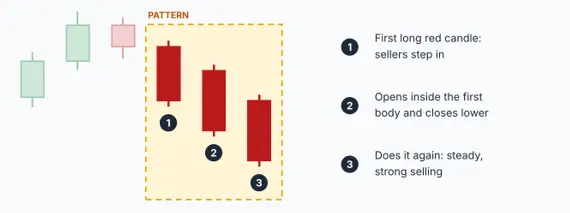
Diagram: three long red candles, each closing lower than the last.
What it looks like: Three black crows are the bearish twin of the three white soldiers. They are three long red candles in a row, each opening inside the body of the previous candle and closing lower, with small or no wicks. They usually appear after an uptrend or a quiet sideways phase.
What it is telling you: Sellers win three periods in a row with almost no pushback. Small lower wicks show that sellers kept control until the close each time. It shows steady, determined selling and often confirms that a top is in.
How to use it: It is most meaningful near a resistance level or after a long rise. As with the soldiers, very large candles after a long fall can mean the selling is exhausted, so a bounce may follow. Some traders wait for a small bounce after the pattern and then look for a chance to sell or to exit long trades.
Using candlestick patterns in crypto trading
Candlestick patterns work on any liquid market, including crypto, but crypto has a few quirks you should know about. Crypto markets never close, so there are no overnight gaps like the ones you see in stock markets. Patterns that rely on gaps, such as the morning star and the evening star, are usually read more loosely. You look for the idea behind the pattern instead of a perfect gap.
Crypto prices can also spike suddenly on news or large orders, which creates long wicks that fade quickly. A long wick on a one-minute chart might mean nothing, while the same wick on a daily chart means much more. As a general rule, patterns on higher timeframes such as the 4-hour or daily chart are more reliable than patterns on the 1-minute or 5-minute charts.
Finally, if you trade crypto futures with leverage, small price moves turn into large gains or losses, so risk control matters even more. Always decide your stop-loss before you enter a trade, and never risk more on a single pattern than you can afford to lose.
Common mistakes beginners make
Trading every candlestick patterns you see: Patterns appear all the time, and most of them lead nowhere. Take only the ones that appear in the right place, with the right trend and some confirmation.
Ignoring the trend. A bullish pattern inside a strong downtrend is usually just a pause. Trade with the bigger trend unless you have strong evidence that it is turning.
Skipping the stop-loss. No pattern works every time. A stop-loss turns a failed pattern into a small, planned loss instead of a big surprise.
Using patterns alone. Combine candlestick patterns with simple tools such as support and resistance, moving averages, or the RSI indicator to get a fuller picture.
How to practise candlestick patterns
The best way to learn candlestick patterns is to open a chart and look back in time. Pick a coin or stock you follow, set the chart to the daily timeframe, and scroll back a few months. Try to find each pattern from this guide, check where it appeared, and see what price did afterwards. You will quickly notice that some patterns worked and some failed, and that the ones that worked usually appeared at clear support or resistance levels.
Once you are comfortable, practise on a demo account or with very small amounts before you trade with real money. Keep a simple notebook with a screenshot of each pattern, what you expected, and what actually happened. After a few weeks you will have your own record of which patterns you trust.
Final thoughts
Candlestick patterns are not magic, and they will not predict the future. What they do is show you, in a simple visual way, who is winning the fight between buyers and sellers right now and whether that fight might be changing. Learn the shapes, understand the story behind each one, and always check the trend, the location, and the confirmation before you act.
Start small. Pick a few patterns from this guide, practise spotting them on past charts, and slowly build your confidence. Over time you will stop seeing random red and green bars and start seeing the psychology behind the market.
Do candlestick patterns work in crypto?
Yes. Candlestick patterns show buying and selling behaviour, and that exists in every market with enough trading activity. They tend to work better on higher timeframes and in coins with high trading volume.
Which timeframe is best for candlestick patterns?
There is no single best timeframe, but longer ones such as the 4-hour and daily charts produce fewer false signals. Shorter ones show more patterns but also more noise. Beginners usually do better starting with the daily chart.
Which candlestick pattern is the most reliable?
No pattern is reliable on its own. Traders generally trust the engulfing patterns, the morning and evening stars, and the three white soldiers and three black crows more than single-candle patterns, because they show a bigger shift in the balance between buyers and sellers. Even these work best at support or resistance levels and with confirmation.
How many patterns do I need to learn?
You do not need all 20 at once. Start with the hammer, the shooting star, the two engulfing patterns, and the morning and evening stars. Add the others gradually as you get comfortable.