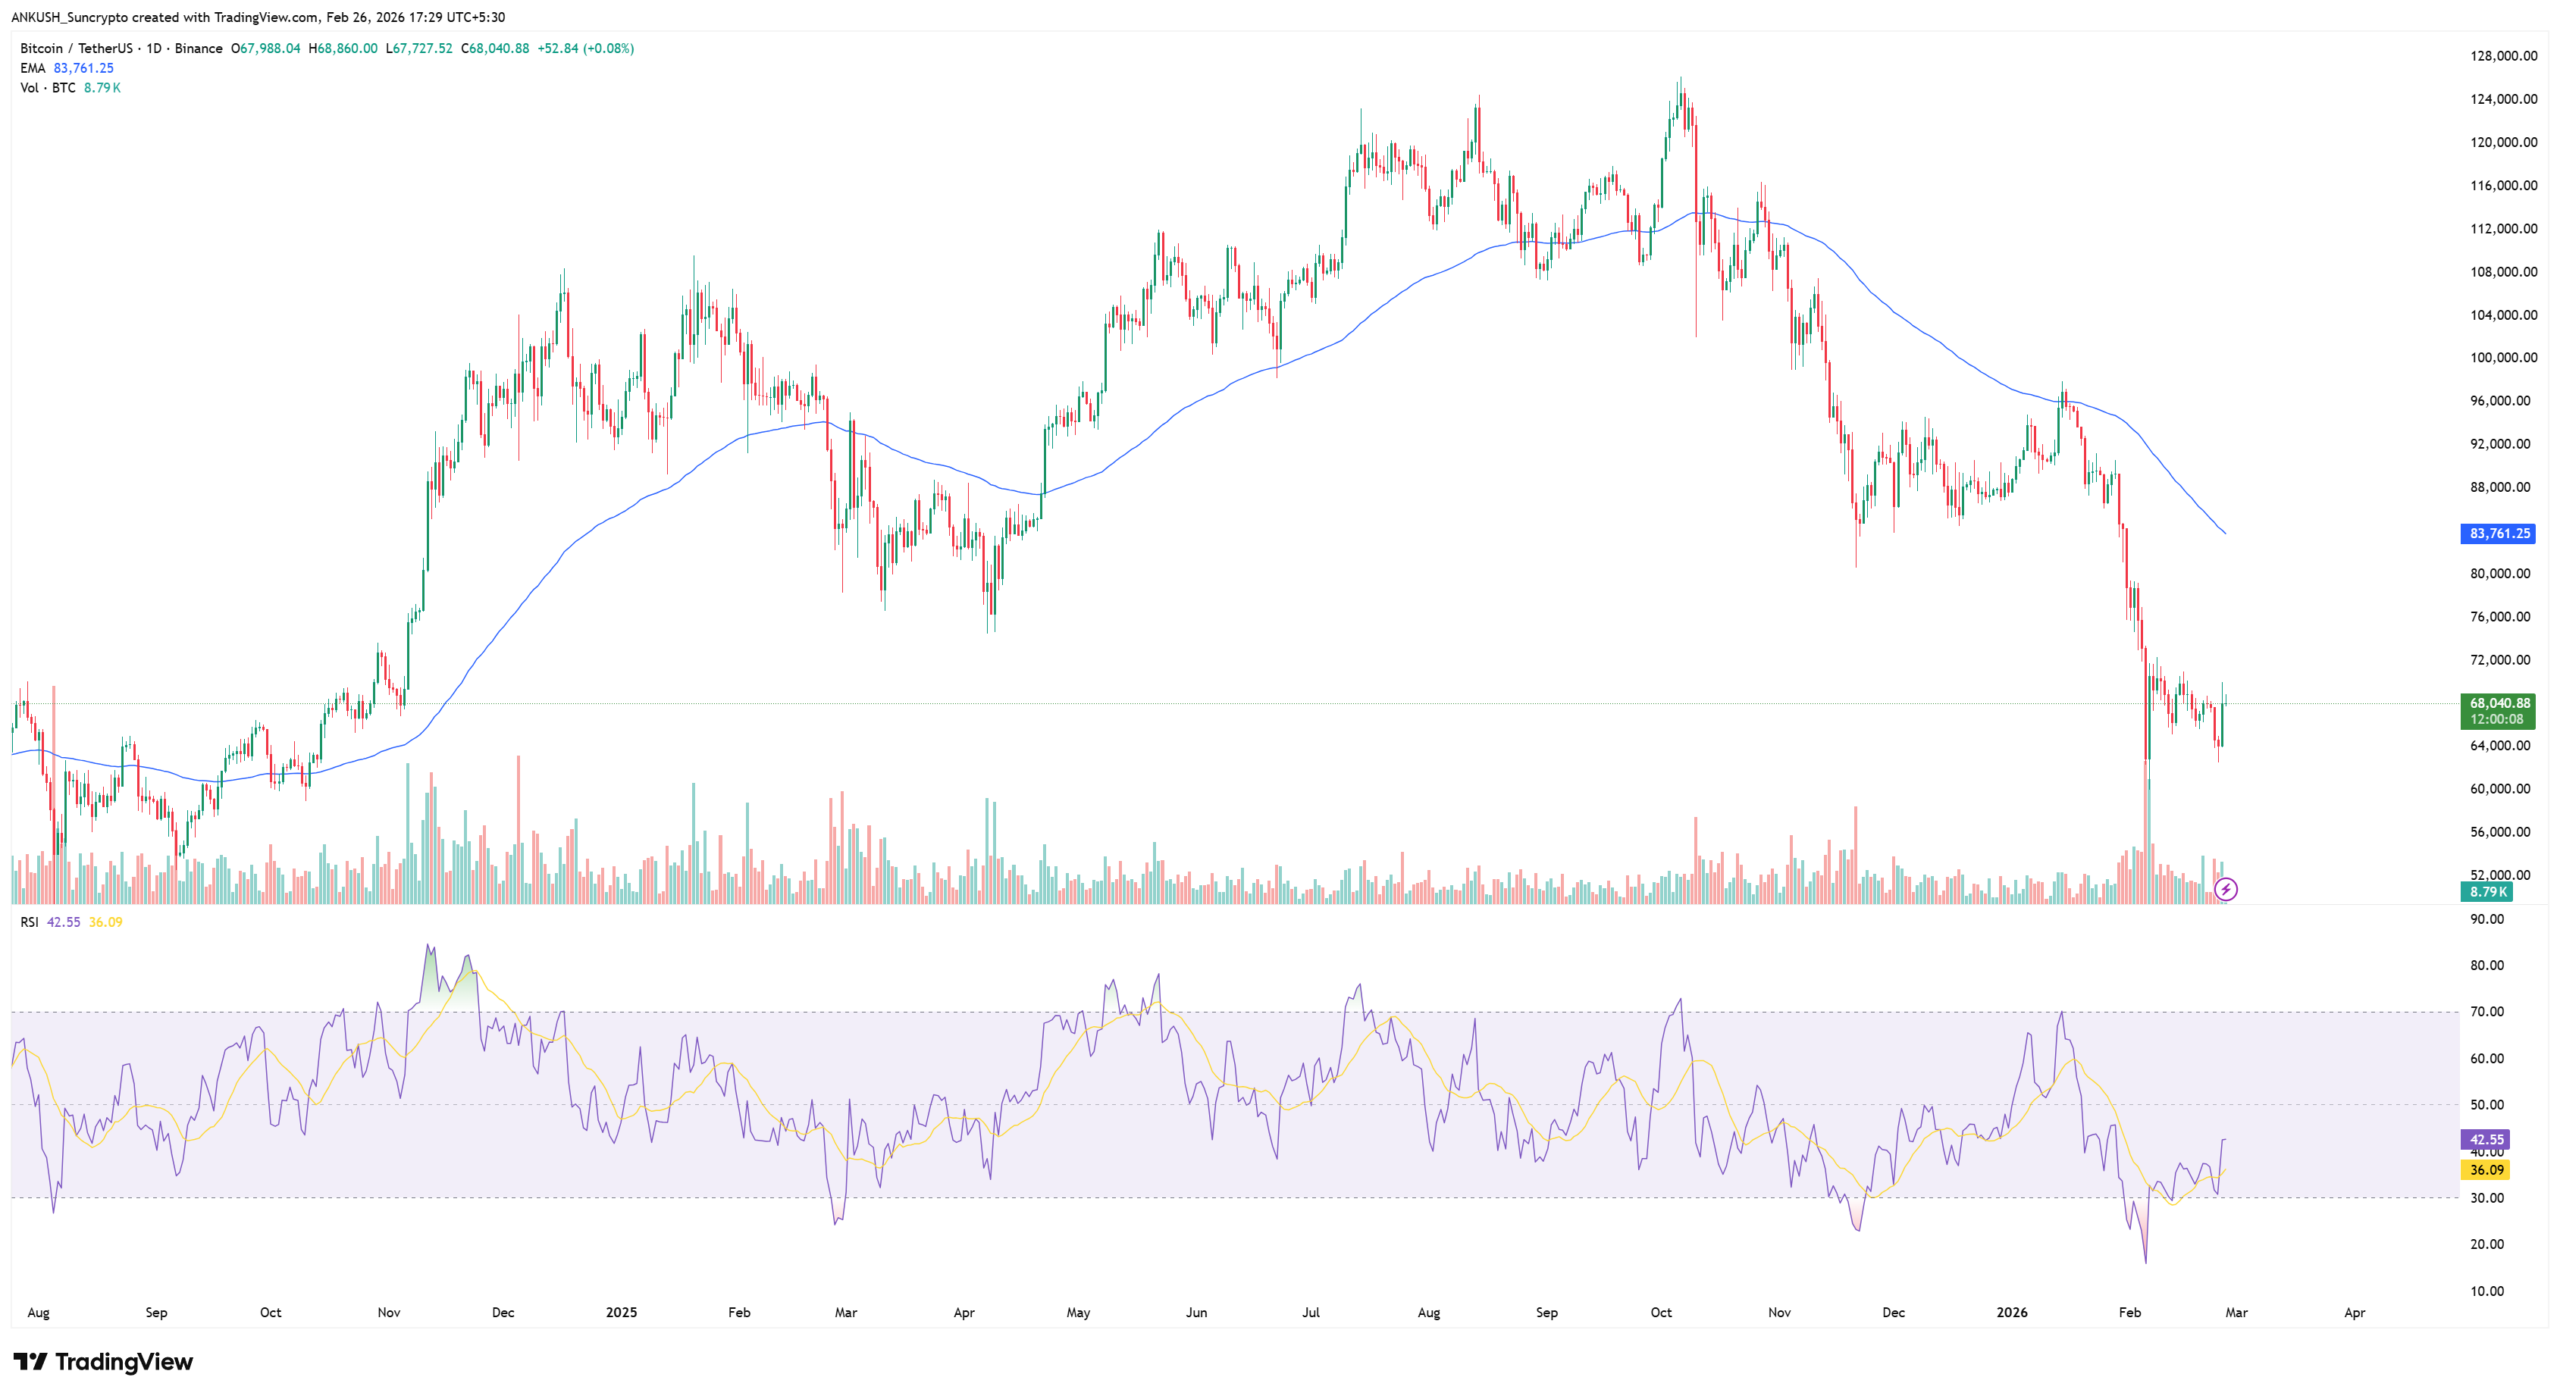
The atmosphere in the crypto market is undeniably heavy. After Bitcoin (BTC) reached a staggering all-time high of $126,000 in October 2025, the subsequent 50% slide to the current $62,000–$69,000 range has many investors asking: How much deeper is this “trap door”?
Why the Market is Shaking?
Bitcoin isn’t falling in a vacuum. A trio of macro headwinds is currently driving the sell-off:
- Tariff Shocks: New 15% global tariff announcements have sparked inflation fears, pushing capital out of “risk-on” assets like BTC and into the safety of cash and gold.
- The AI Rotation: Investors are shifting funds from crypto into AI sectors as the market weighs how artificial intelligence might disrupt traditional software and payment systems.
- Institutional Exit: For the first time in months, spot Bitcoin ETFs are seeing consistent net selling, weakening the institutional “floor” that supported the 2025 bull run.
The Bear Case Study of Bitcoin Price
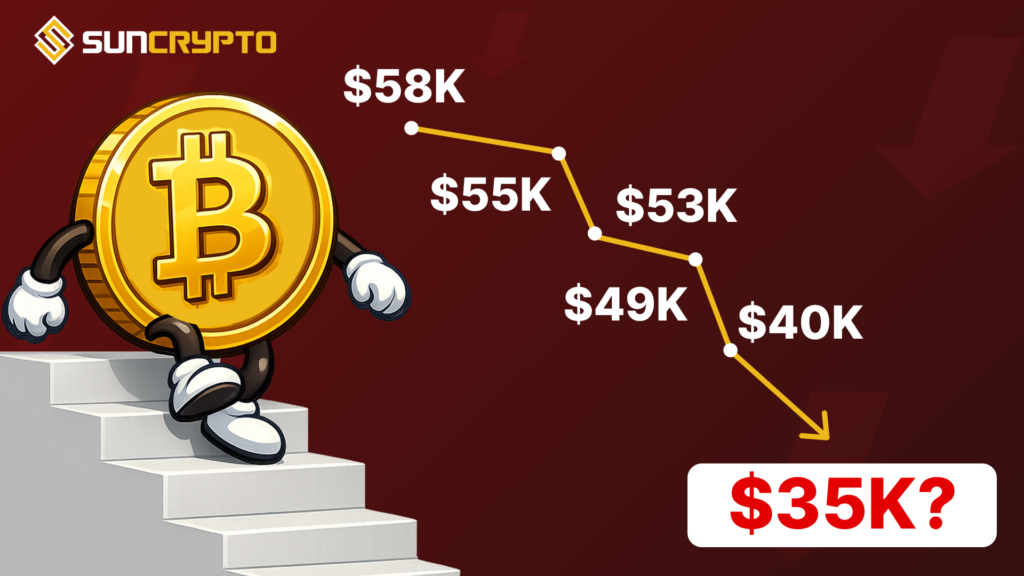
Technical analysts are fixated on the $60,000 psychological level. If that line in the sand breaks, experts have identified three primary “bottom” targets:
|
Target Level |
Rationale |
|
$55,000 – $58,000 |
The 200-week Moving Average is, historically the most reliable ultimate bottom in bear cycles. |
|
$49,000 – $53,000 |
The “Deep Value” zone. Major support from late 2024 and a key “Wave 5” capitulation point for Elliott Wave theorists. |
|
$40,000 |
The “Disaster Level.” A worst-case scenario representing mid-2024 breakout zone a ~68% correction from the peak. |
Is $35,000 a Realistic Target for Bitcoin?
While some bears are calling for $35,000, such a move would require a 72% drawdown from the peak. While not unprecedented (2018 and 2022 saw 75%+ drops), several massive barriers stand in the way:
- The $60k Battleground: We recently bounced off $62,500; as long as this holds, $35k remains a fringe theory.
- Required Catastrophes: To hit $35k, we would likely need total institutional capitulation (ETF exits), a confirmed recession forcing the Fed to raise rates in 2026, and a miner death spiral where operators dump holdings to cover electricity costs.
Most analysts view $45,000–$50,000 as the more “realistic” floor. A drop to $35,000 would represent a total breakdown of the established 4-year cycle theory.
The Silver Lining for Bitcoin
Despite the gloom, there are reasons for optimism. A “double bottom” formed near $62,500 this week, and prices climbed back toward $69,000 following the State of the Union address.
Current Sentiment – daily charts are showing a “bullish divergence.” This means that while prices are low, the actual selling momentum is fading—a classic sign that a bottom may be closer than the headlines suggest. If BTC can close a week above $70,000, the “bear market” narrative may quickly shift back to a “mid-cycle correction.”
Disclaimer: Crypto products & NFTs are unregulated and can be highly risky. There may be no regulatory recourse for any loss from such transactions.